Mining
Find the early warning signs in your crushers, mills, slurry pumps, conveyors, and process circuits before they become downtime, lost throughput, or another unanswered shift handoff. Grayson TimeSeries Lite runs deterministic analysis inside Microsoft Copilot and explains what is changing in plain English.
No new subscription. Runs on your existing Microsoft 365 Copilot license.


Use Cases
The warning signs are already in your mining data
Mining teams are surrounded by historian data, but the people closest to the equipment often do not have time to manually trend every crusher, mill, slurry pump, conveyor, and process-circuit signal. Early warning signs get buried in CSV exports, dashboards, shift notes, and alarm noise.
Grayson TimeSeries Lite helps engineers and operators ask direct questions of that data and get evidence-based answers backed by deterministic models.
The cost: A crusher trip or unplanned crusher outage can starve the downstream circuit, reduce throughput, and force maintenance teams into reactive troubleshooting.
What Grayson does: Tracks motor current variance, vibration, lube oil temperature and pressure, feed rate, and discharge behavior to surface patterns consistent with overload, bearing issues, lubrication problems, or abnormal operating variance.
Ask Grayson: “Here’s the last 14 days of motor current, vibration, lube oil temperature, and feed rate for Primary Crusher 2. Is the data showing a pattern consistent with overload or developing mechanical issues?”
Outcome: Help the operator prove whether “this crusher doesn’t look right” is backed by current, vibration, lubrication, and feed-rate data analysis.


The cost: Mill instability can reduce throughput, increase energy use, accelerate liner wear, and create downstream variability across the processing circuit.
What Grayson does: Tracks mill power draw, bearing pressure, vibration, feed rate, speed, density, and discharge behavior to surface signatures of overload, underload, liner wear, or abnormal process variation.
Ask Grayson: “Here’s two weeks of SAG mill power draw, bearing pressure, vibration, feed rate, and density. Are the trends consistent with load instability, liner wear, or abnormal operating variance?”
Outcome: Help the engineer confirm whether the mill data supports a hunch about load instability, liner wear, or changing operating behavior.
The cost: A degrading slurry pump can reduce flow, increase energy draw, damage wet-end components, and create process interruptions before the issue is obvious in production.
What Grayson does: Correlates suction pressure, discharge pressure, flow, density, motor current, and vibration to surface patterns consistent with cavitation, impeller wear, liner wear, plugging, or off-curve operation.
Ask Grayson: “Compare suction pressure, discharge pressure, flow, density, and motor current for Slurry Pump 4 over the last month. Does the data suggest cavitation, wear, or a developing restriction?”
Outcome: Help the team verify whether changing pressure, flow, density, current, and vibration patterns point to pump wear, cavitation, or plugging, not just normal process variation.

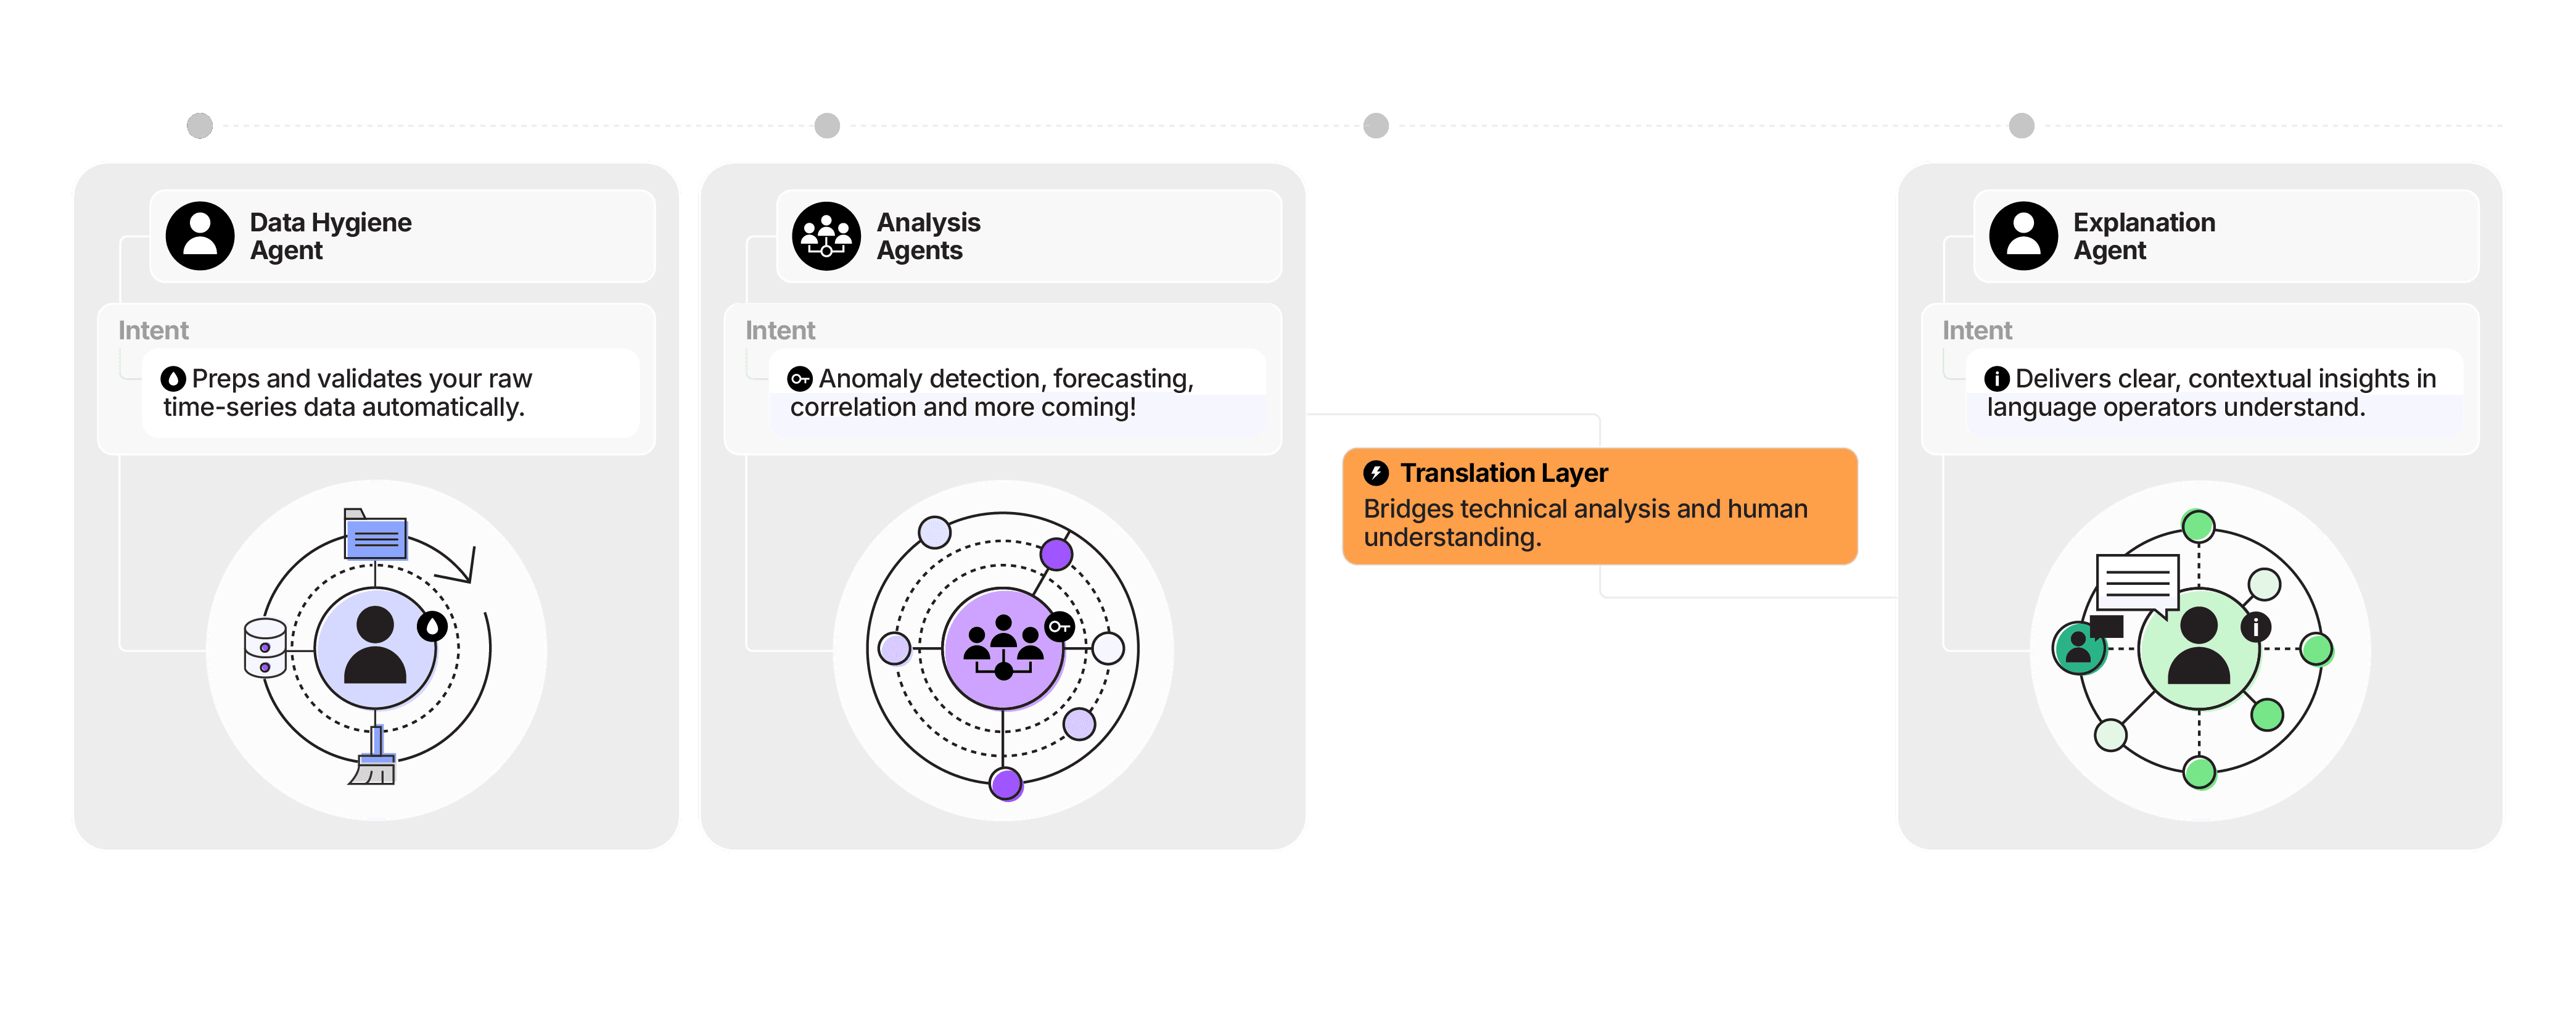
How it works
How It Works
The Agentic Advantage
Agents expand your capacity.
A force multiplier for the engineer: your shift, your call, more answers in your hands..

FAQ
Answers to help you get started faster.
Real stories from teams who streamlined their workflow and delivered more with less.
