Made for the engineer closest to the problem

Investigate your process data.
On your own.

Something looks off? Need an answer before a meeting? Grayson Timeseries puts trusted anomaly detection, forecasting, correlation and data checks inside the AI tools you already use.

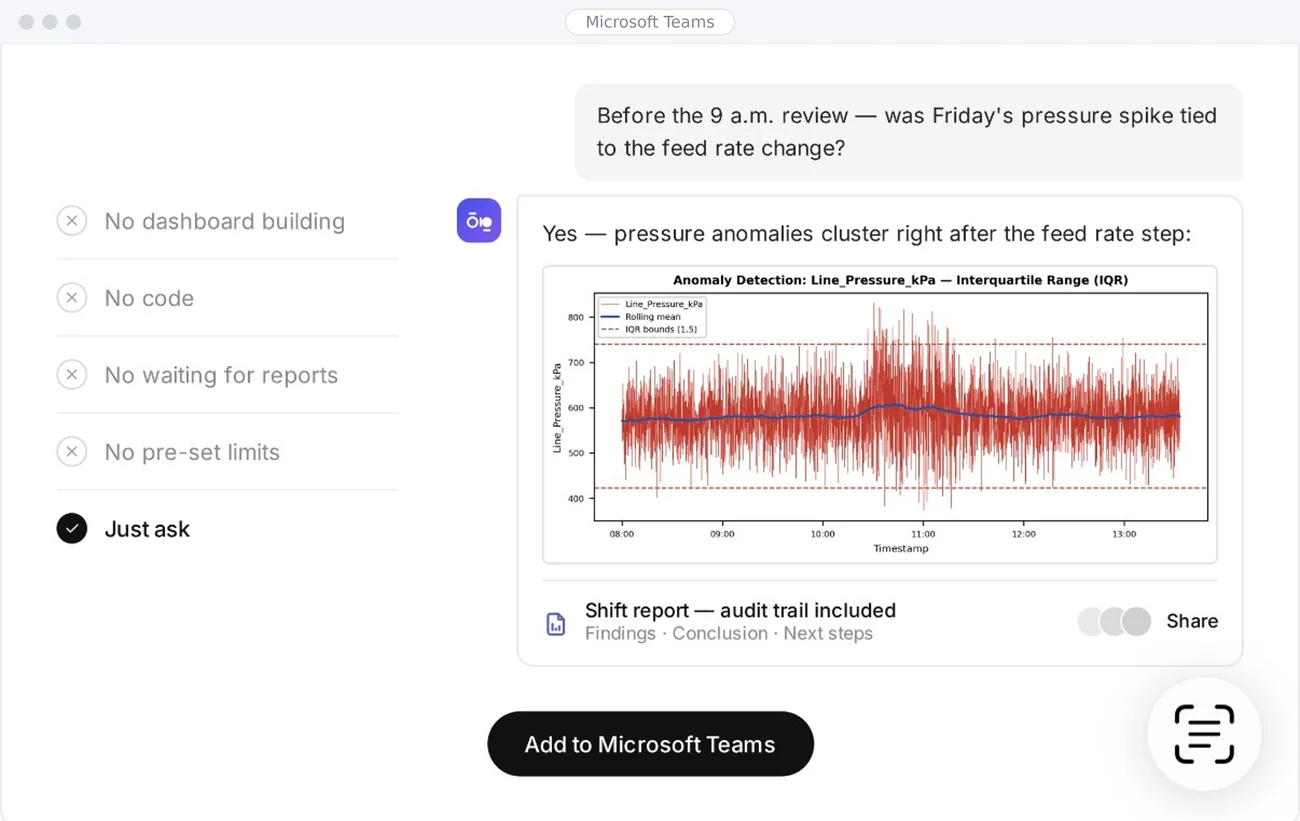
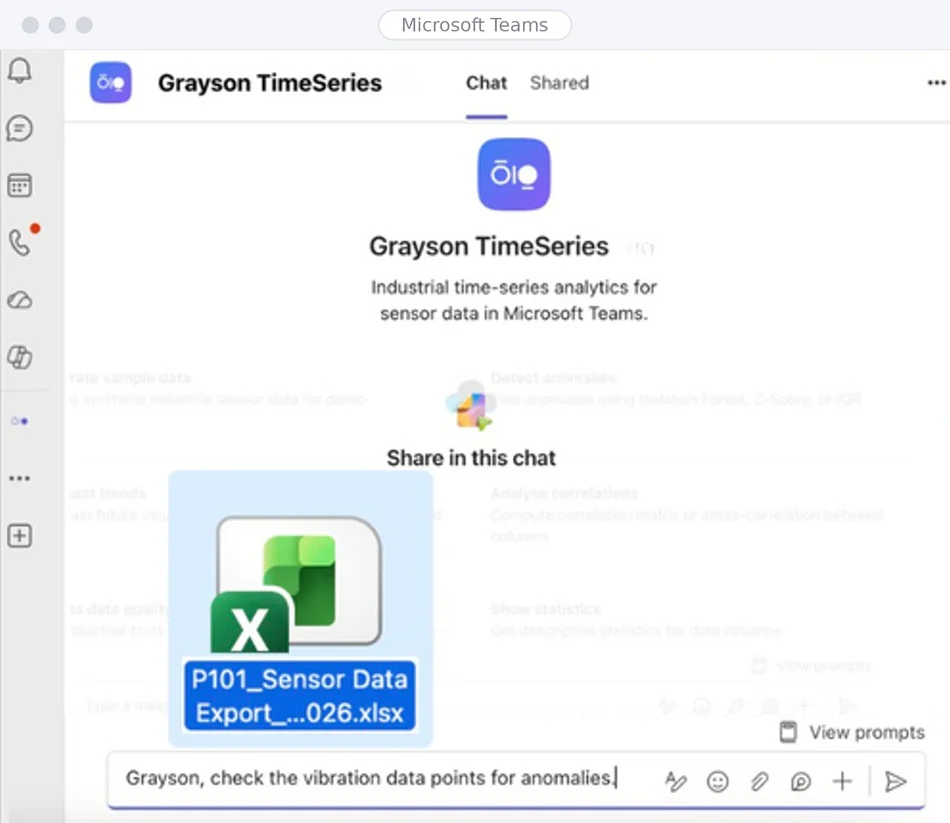
Grayson TimeSeries conversation with an anomaly detection graph in Microsoft Teams

Two ways to work with Grayson Timeseries

From Fast Answers to Deeper Insights

01
Free · except Microsoft Teams

Grayson Timeseries

Get trusted process analysis right in the AI tools you already use. Upload a CSV or Excel export, ask questions in plain language, and review charts, explanations and an audit trail.

Use Grayson FreeSee how Timeseries works ↓

How to use Grayson Timeseries

Grayson Timeseries

Grayson Timeseries provides specialized agents that run deterministic statistical and machine-learning models in the chat tools organizations already use.

1

Open Grayson

Choose ChatGPT, Claude, Gemini or Grok to start free. Prefer an organization-managed experience? Select Teams.

2

Add your data

Drop in a CSV or Excel (.xlsx) file up to 10 MB, such as an export from a data historian, spreadsheet or sensor system.

3

Ask

Type a question in plain language, or use guided controls to choose a variable, time window and analysis method.

4

Explore the result

View charts, explanations and the recorded methods. Export the findings, ask follow-ups or access Timeseries Premium for deeper review.

You don't need to know the algorithm.

Click below to see examples

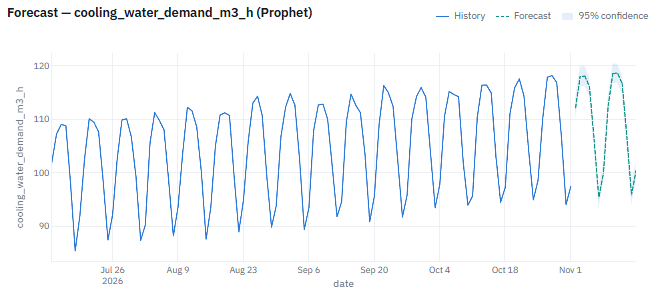
When will cooling-water demand peak?
ForecastingDeterministic tools

Forecast cooling-water demand

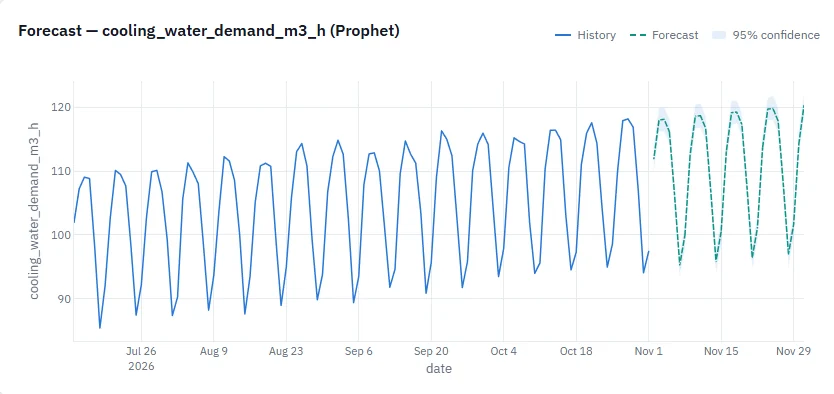
Prophet keeps the weekly swing in cooling-water demand and projects the next peaks inside a 95% confidence band. Compare that forecast with a simple moving average and a linear trend.

Prophet forecast of cooling-water demand, with history, a dashed forecast, and a 95% confidence band
ProphetSimple moving averageLinear trend

Grayson Timeseries Agents

Find what's unusual
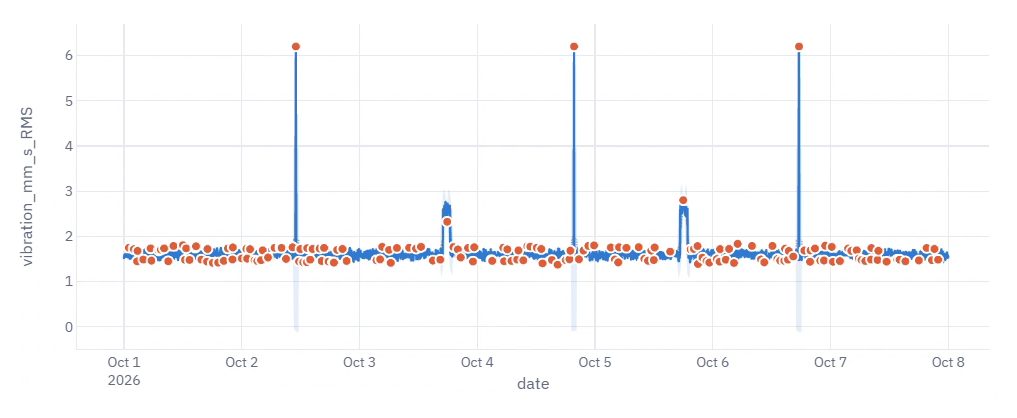
Sample anomaly chart with vibration spikes marked in orange

Anomaly detection agent

Identify unusual operating values, spikes, shifts and abnormal patterns.

Isolation Forest

Finds observations that are unusually different from the rest of the data. Useful for complex outliers that a single limit might miss.

Z-Score

Measures how far a reading is from the average in standard deviations. A clear baseline for unusual high or low values.

Interquartile Range (IQR)

Flags values outside the distribution's middle range. A robust way to identify outliers without relying on the mean.

Variational Autoencoder (VAE)

Learns typical patterns and flags readings that are difficult to reconstruct. Useful for more complex operating behaviour.

Try asking: “Which vibration spikes were unusual, and which methods agree?”

See what's next
Sample forecast chart with history, a dashed forecast, and a confidence band

Forecasting agent

Estimate future values and compare a prediction with simpler baselines.

Prophet

Models time trends and recurring seasonal patterns. Useful when production or demand follows predictable cycles.

Simple Moving Average (SMA)

Averages recent measurements to smooth noise and show a near-term baseline.

Linear Trend

Fits a straight-line trend to show the direction and approximate pace of change. A simple benchmark for more complex forecasts.

Try asking: “Where is cooling-water demand heading over the next two weeks?”

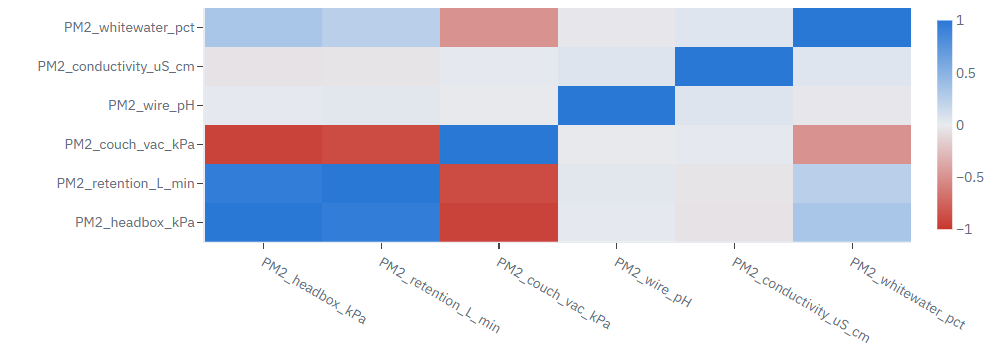
Understand relationships
Sample correlation heatmap across process variables

Correlation agent

Discover which process variables move together, and whether the relationship changes over time.

Pearson

Measures the strength of a linear relationship between two variables.

Spearman

Compares ranked values to capture consistent relationships that are not necessarily straight lines.

Rolling Correlation

Measures how a relationship strengthens or weakens across successive time windows.

Cross-Correlation

Tests relationships at different time offsets to explore whether one signal tends to lead or lag another.

Try asking: “Which variables move with pressure, and does one change first?”

Check the data first
  • Missing values
  • Irregular sampling
  • Outliers

Data quality score: 97%

Data hygiene agent

Understand whether the uploaded measurements are ready for analysis.

Missing readings

Surfaces gaps and absent values that can distort comparisons or forecasts.

Irregular sampling

Identifies inconsistent time spacing that may require attention before analysis.

Outliers and quality checks

Highlights questionable readings and provides a data-quality view so you can decide what needs review.

Try asking: “Is this historian export clean enough to analyze?”

Try it with your data.

In the tools you use.

Use Grayson Free

Grayson Timeseries Premium

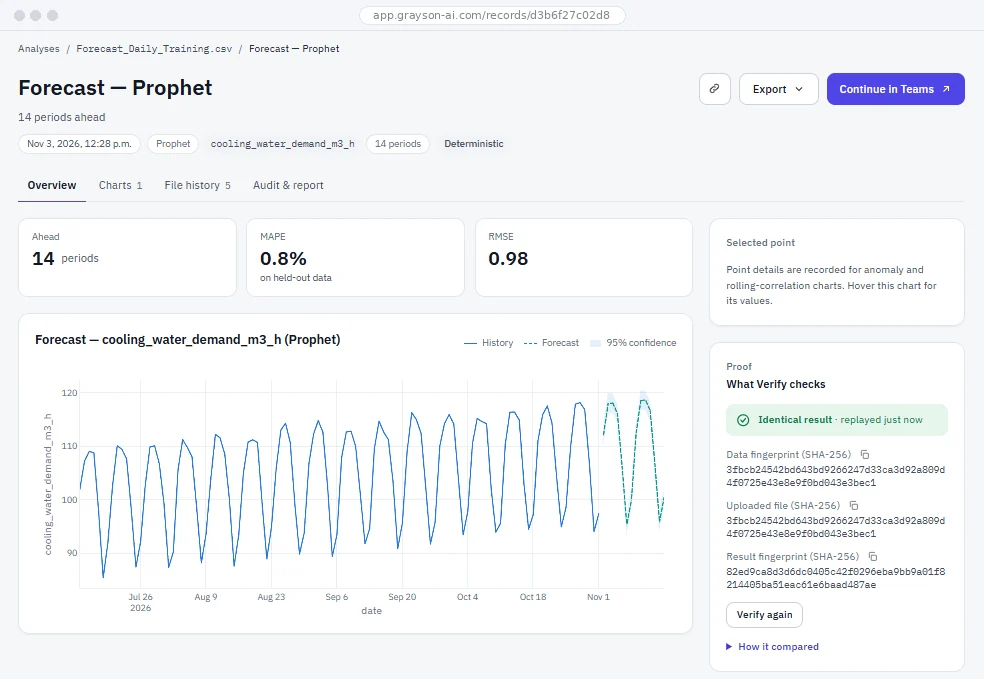
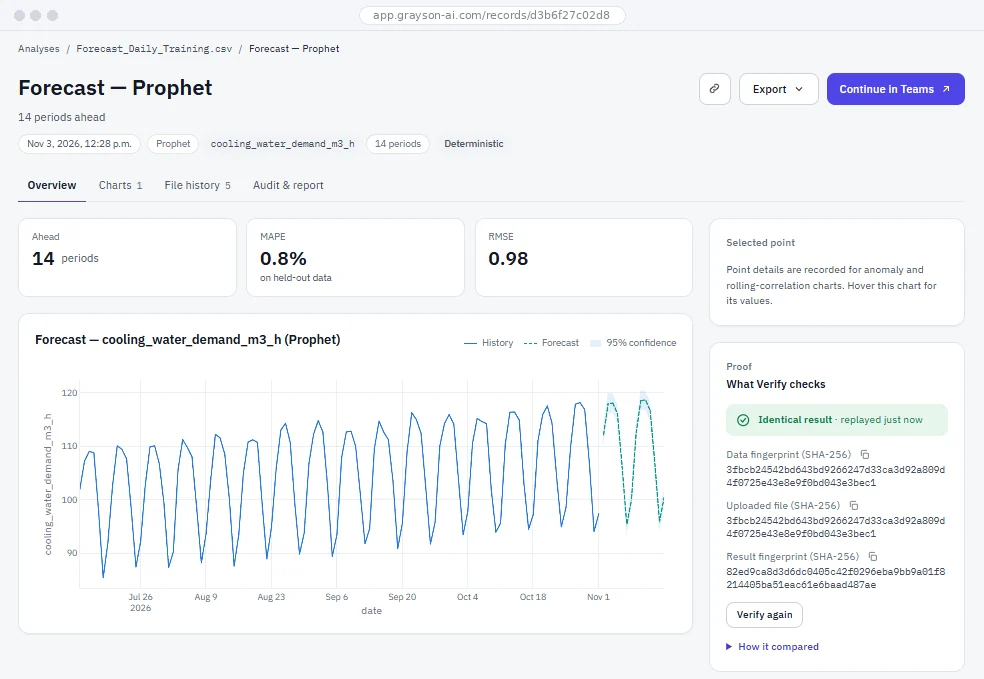
Timeseries Premium allows for deeper exploration and reporting for individual engineers through access to a powerful interactive workspace.

Timeseries Premium forecast analysis dashboard with interactive chart, metrics and proof panel

Premium Features

Get a richer, interactive workspace to examine the evidence.

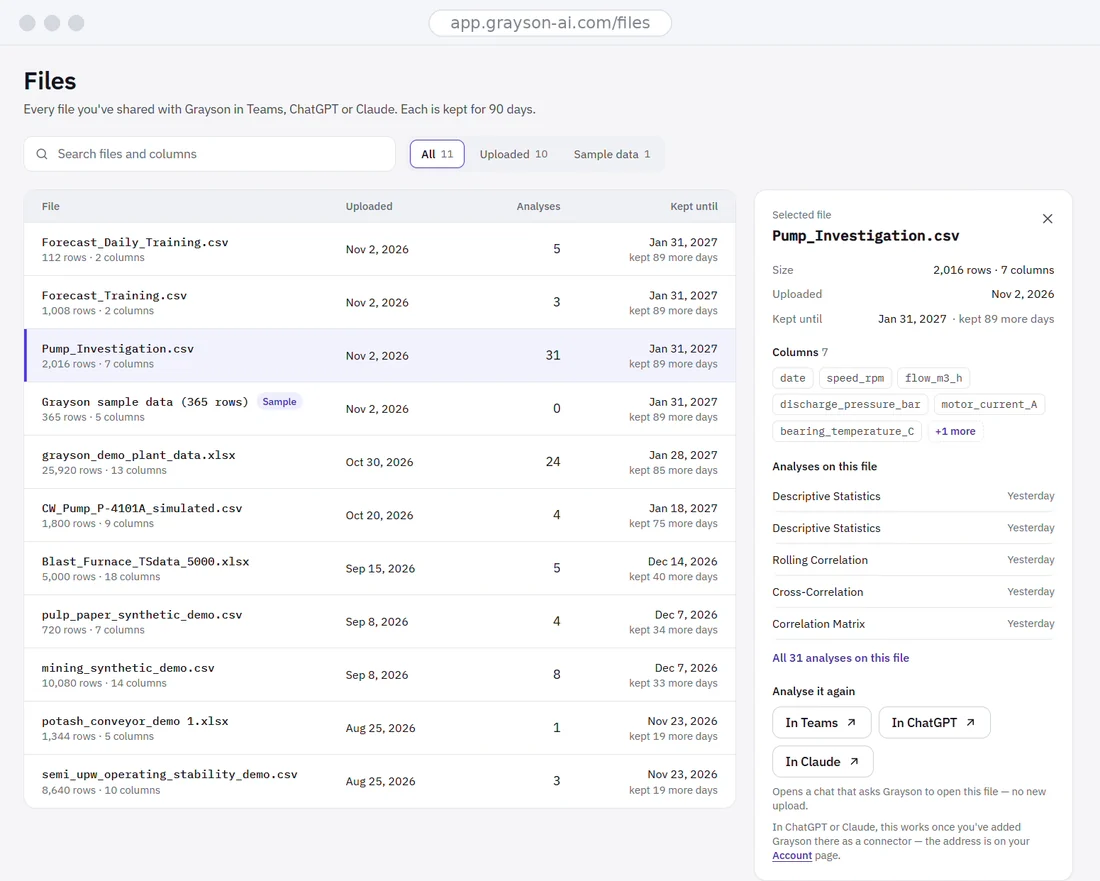
Analysis Library

Return to uploaded files and previous analyses.

Timeseries Premium list of uploaded files and their analysis records

Interactive charts

Hover, zoom, select time ranges and inspect individual readings.

Interactive forecast graph in Timeseries Premium

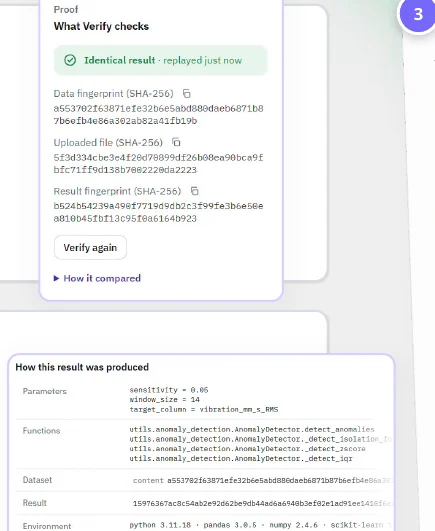
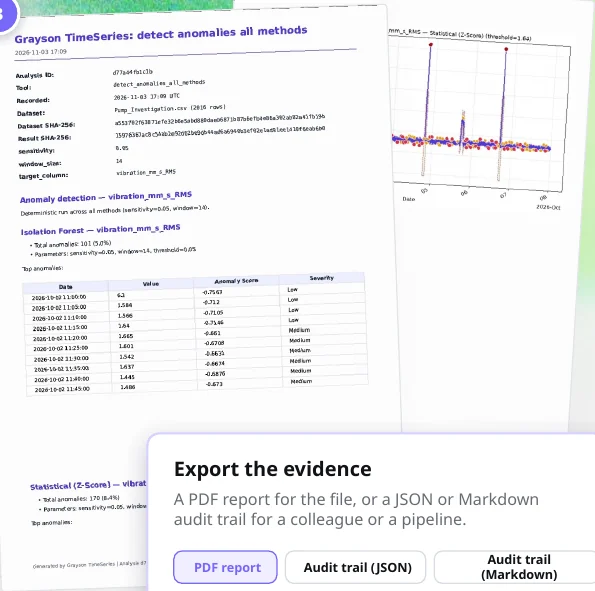
Detailed Audit Reports

Verify stored runs and export PDF reports, JSON or Markdown audit trails.

Timeseries Premium verify panel showing SHA-256 fingerprintsTimeseries Premium PDF audit report and export controls

When you need more than individual access

Grow into Grayson Industry.

Bring historians, assets and operational context together with enterprise insights, governance and deployment options.

For teams, plants and enterprises

Move from a single engineer's analysis to a capability used across operations.

Context from your systems

Connect to data historians and asset frameworks, and display measurements in a 3D digital twin.

Enterprise governance and hosting

Support organization-wide insights, governed deployment and on-premises or custom hosting options.

Frequently Asked Questions

Visit support
What files can I upload?

CSV and Excel (.xlsx), up to 10 MB per file. Grayson is designed for time-stamped process and sensor measurements, including exported historian data. Supported files may differ between the AI tool being used.

What if I don't know which analysis to run?

Describe what you're trying to understand — for example, “Why did pump discharge pressure spike?” — or use guided analysis controls to select a variable, method and time range. You can run several supported methods and compare their findings.

Does the AI itself calculate the answer?

Grayson's analytical layer executes established statistical and machine-learning methods. The conversational AI is used to interpret questions and explain results, rather than generate the underlying calculation code afresh for each answer. Explanatory wording can still vary and should be reviewed.

How do I check that the results are trustworthy?

Review the data and assumptions, compare methods where appropriate and use the audit trail to inspect functions, parameters, dataset details and result fingerprints. Timeseries Premium adds a stored-run verification flow and detailed evidence exports. Engineering judgment still matters.

Can Grayson connect to my historian or database?

Grayson Timeseries is file-only: upload a CSV or Excel export from your historian, database or sensor system. Explore Grayson Industry for connection options.

Does Grayson replace my dashboards or analytics platform?

Not necessarily. It is often used as a complementary solution for existing historians, dashboards and advanced analytics tools by making everyday, ad hoc questions accessible to the engineer with the operational context.

Why is Teams paid if I can use Grayson elsewhere for free?

Teams supports a governed organizational route: admins can manage app availability, access assignments, permissions and deployment. The paid Teams option is positioned for organizations that need that management layer, not because the underlying statistical methods are different. Teams use may require IT approval.

How does Timeseries Premium differ from Timeseries?

Timeseries is the free file-based starting point for individual engineers. Timeseries Premium is its paid upgrade: it adds historian/database connections, an interactive workspace, retained file/analysis records, point-by-point investigation, stored-run verification and more complete reports and audit exports.

How long are files available in Timeseries Premium?

Uploaded files in the Timeseries Premium library stay available for 90 days.