Chemicals & Petrochemicals

Self-Service Historical Time Series Analytics for Chemical Operations

Compare batch thermal trajectories, heat-exchanger performance indicators, and distillation transition behavior without building another one-off workbook. Grayson TimeSeries helps process, operations, and reliability teams investigate prepared historical process data inside Microsoft Teams using deterministic and auditable methods.

Get answers, quickly, by chatting with your industrial process data inside Microsoft Teams.

Self-service industrial time series analytics

Ask Your Data. Get Answers Now. In Teams.

Get fast, trustworthy answers from your industrial process data through conversation - no new dashboards, no coding, and no waiting for someone else.

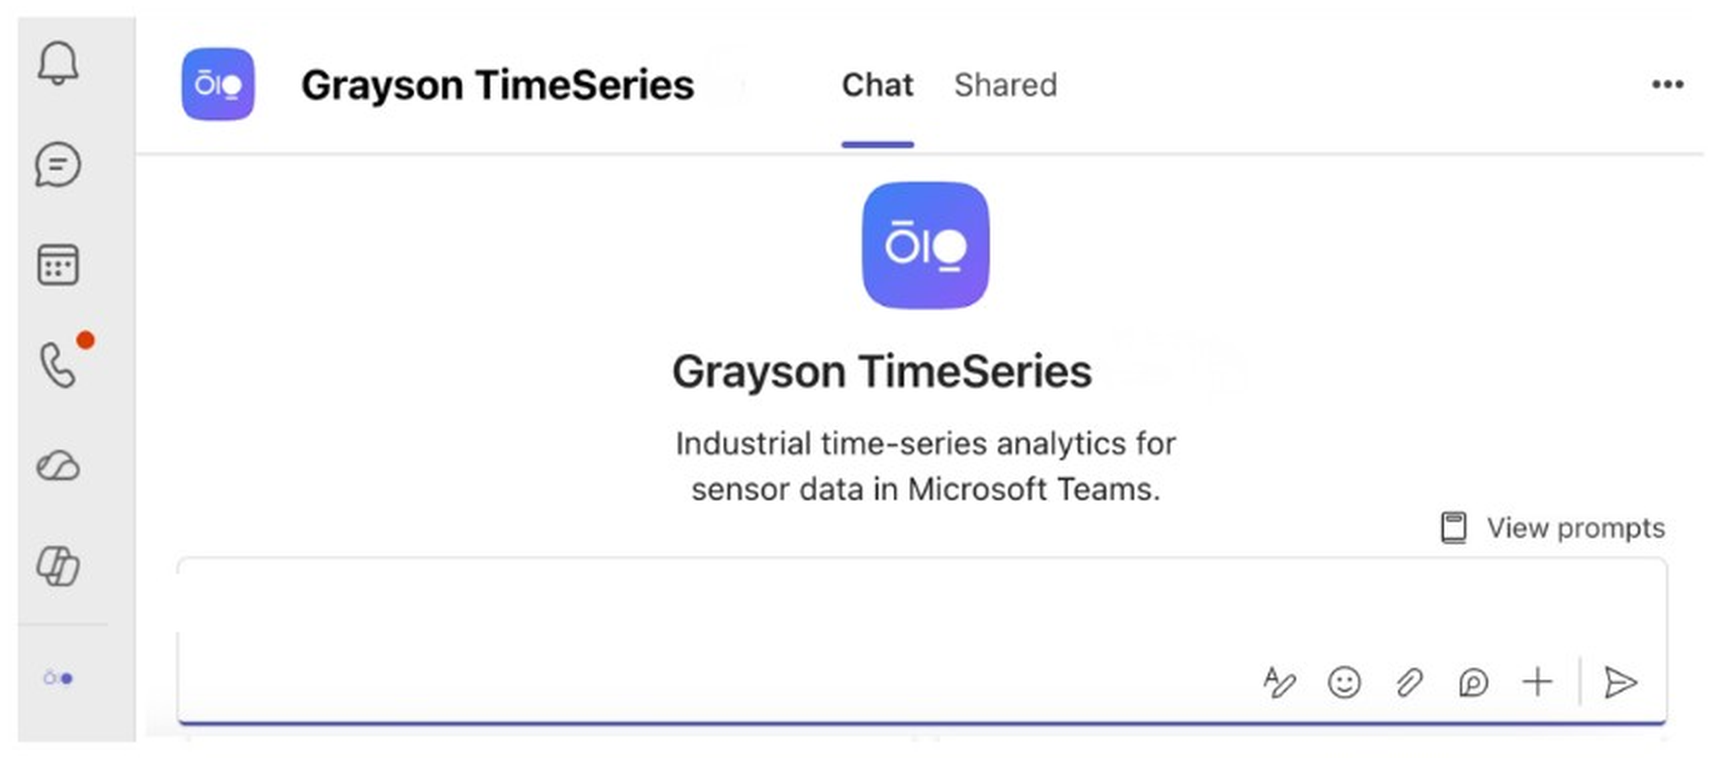
Grayson TimeSeries welcome screen in Microsoft Teams
Use Cases

The answers are already in your historical process data

Chemical plants generate batch histories, reactor and jacket temperatures, feed and utility flows, exchanger temperatures and pressures, column profiles, controller outputs, and operating-state context. The question is often not whether data exists, but whether comparable periods have been prepared for defensible analysis.

Grayson TimeSeries helps the people closest to the problem ask direct questions of one prepared CSV or Excel file and receive evidence-based answers backed by deterministic, reproducible analysis.

Batch Polymerization Thermal-Trajectory Comparison

Why it is hard: Batch profiles vary with recipe, charge condition, feed timing, utility conditions, instrumentation, and operator actions. Temperature divergence does not determine reaction completion or safety margin.

What Grayson analyzes: Prepared batch records with batch ID, elapsed minutes, phase, reactor temperature and setpoint, jacket supply and return temperatures, cooling-valve command, feed rate, recipe, and a prepared reactor-to-jacket delta.

Ask Grayson: “Compare baseline batches with the final four batches during feed and hold phases. When does the thermal relationship begin to diverge, and which recorded signal leads?”

Outcome: Give the process engineer a reproducible list of batches and windows for reviewing records, utilities, instrumentation, heat transfer, and recipe execution.
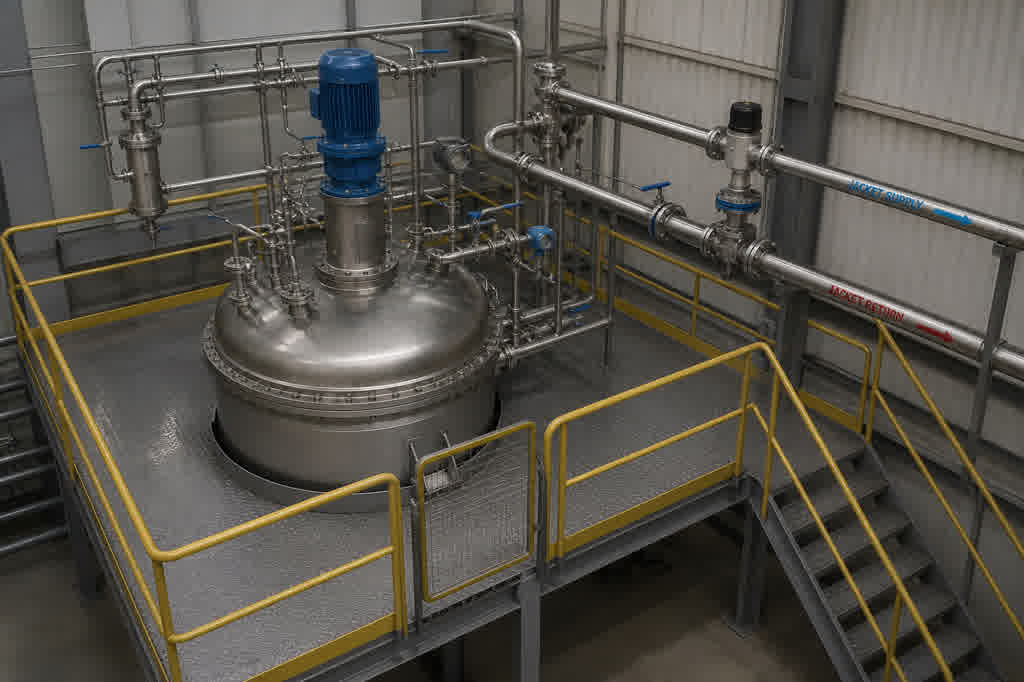
Jacketed chemical batch reactor with feed lines and temperature transmitters

Shell-and-Tube Heat-Exchanger Performance Drift

Why it is hard: Temperatures and pressures can move with process rate, fluid properties, control, utilities, measurement error, and equipment condition. A gradual shift can support a fouling investigation but cannot prove fouling.

What Grayson analyzes: A prepared hourly file containing shell- and tube-side inlet and outlet temperatures, feed flow, tube inlet and outlet pressure, prepared approach temperature, prepared pressure drop, operating state, and maintenance context.

Ask Grayson: “Filter to stable flow and comparable inlet conditions. Compare the first and final 30 days and quantify whether approach temperature and pressure drop move together.”

Outcome: Focus process and maintenance review on the relevant operating periods, sensors, valves, flow measurement, fluid context, and exchanger inspection history.

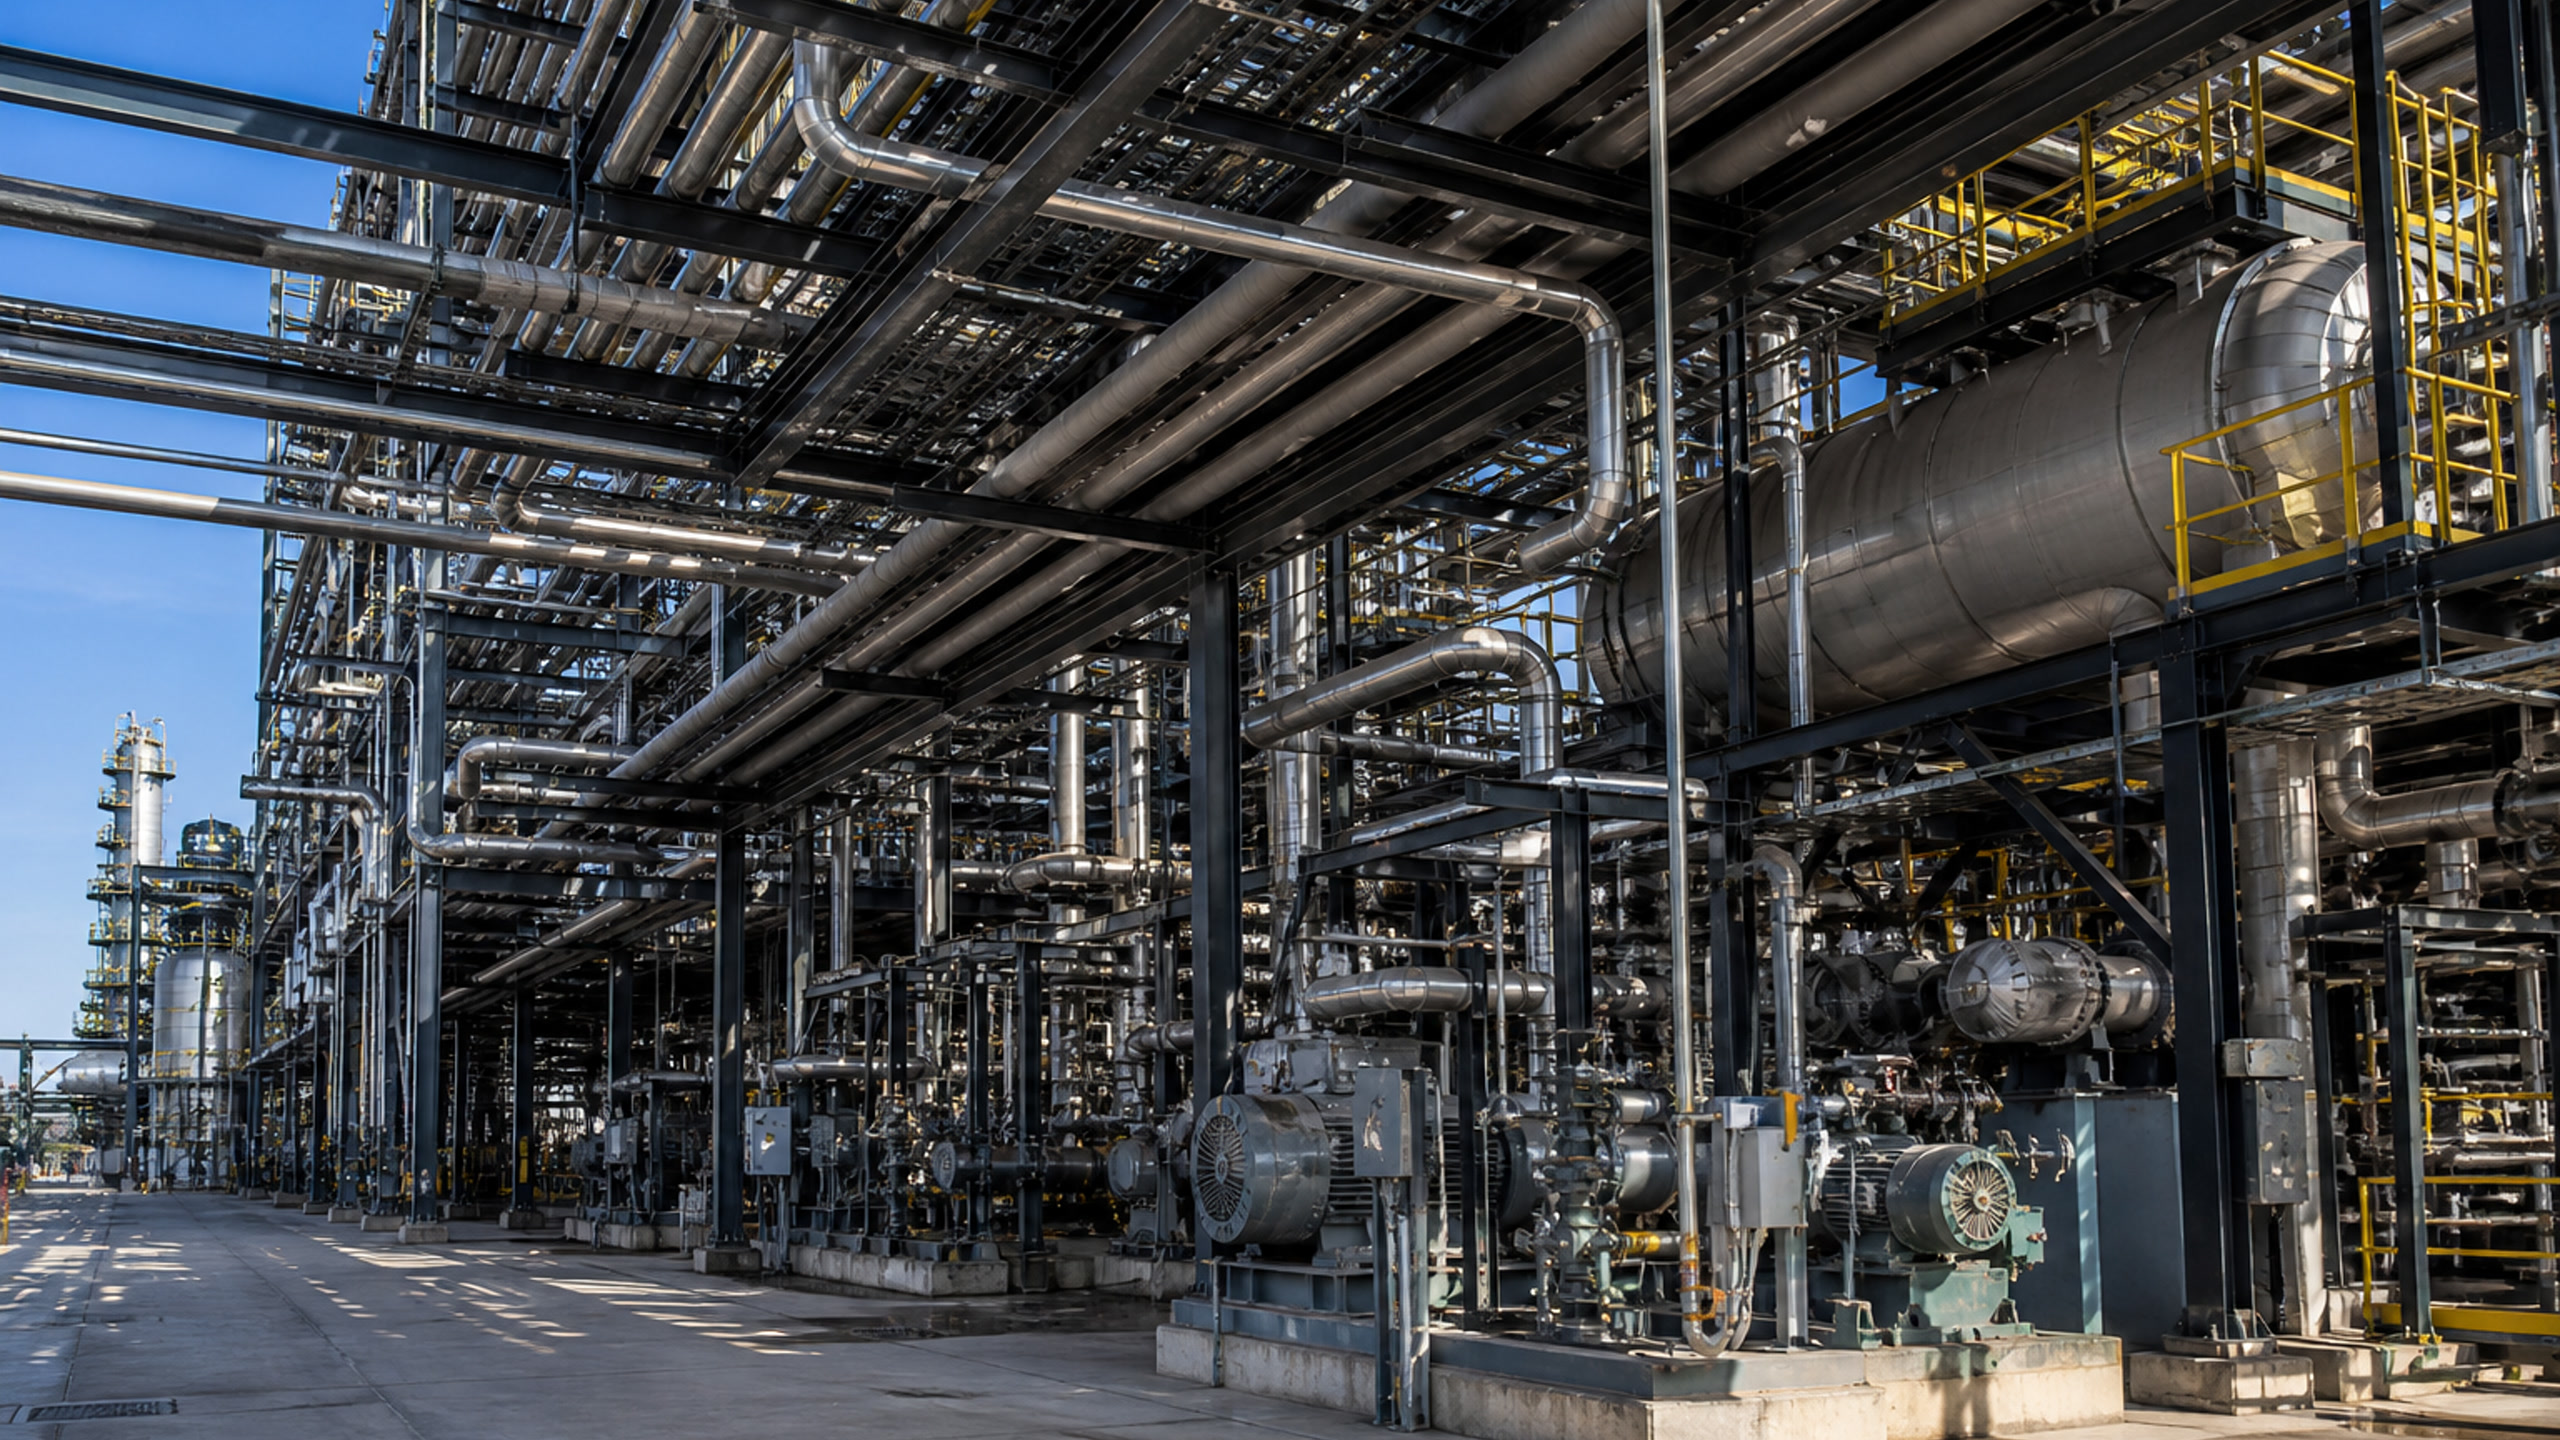
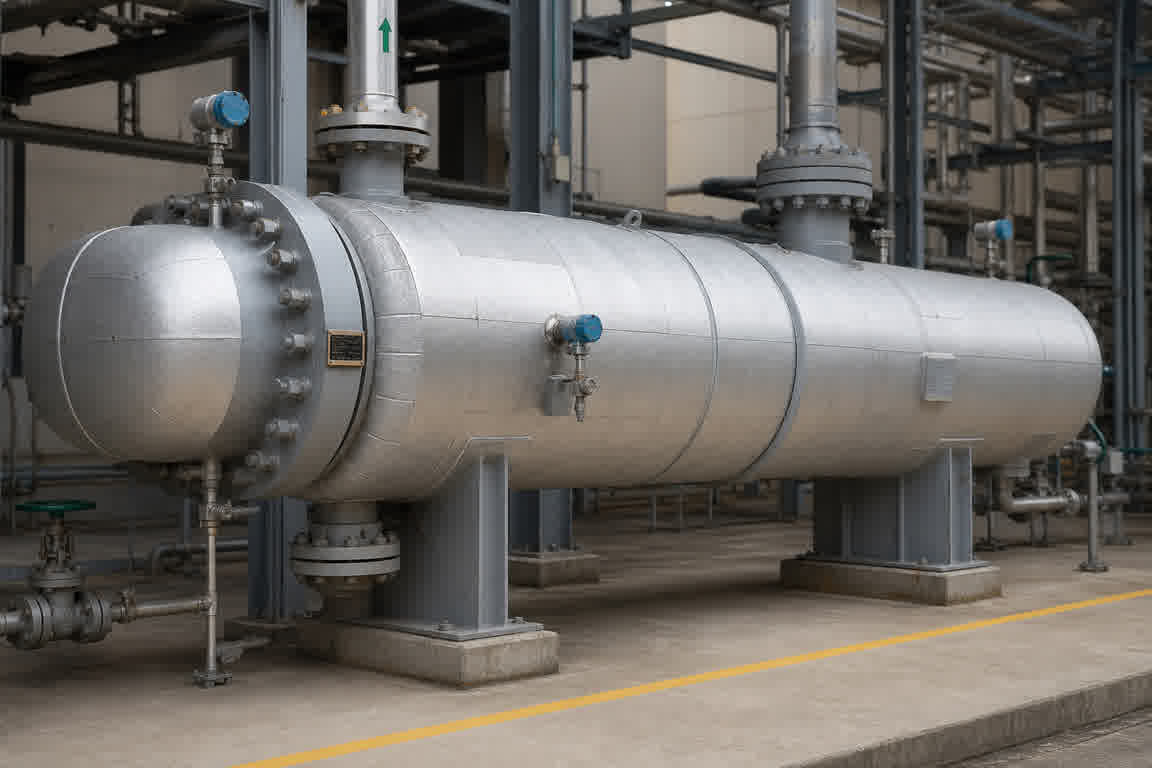
Shell-and-tube heat exchanger in a chemical process unit

Distillation Feed-Transition Stability

Why it is hard: Transition response depends on feed, reflux, reboiler duty, pressure control, tray or packing behavior, composition, instruments, and operator actions. Historical temperature and pressure data do not establish purity or flooding.

What Grayson analyzes: Prepared event-aligned records with event ID, minutes from transition, feed, reflux, reboiler steam, top and bottom pressures, representative tray temperatures, prepared column pressure drop, prepared reflux ratio, and transition phase.

Ask Grayson: “Overlay all five transitions and compare settling time, oscillation amplitude, and lead-lag across feed, pressure, and tray-temperature signals.”

Outcome: Help the process team surface event windows for reviewing feed composition, controls, hydraulics, instrumentation, and operating records.

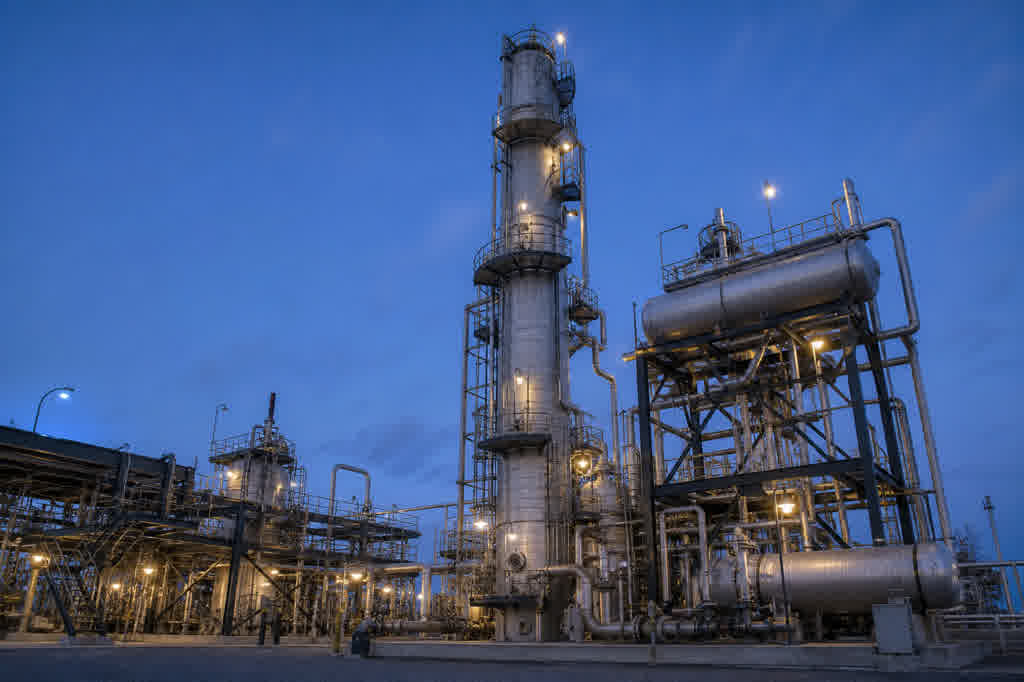
Distillation column process area with overhead condenser and reflux piping

Grayson TimeSeries

Grayson TimeSeries is a Microsoft Teams app that lets engineers and operators individually chat with their industrial process data for quick insights with a deterministic and auditable AI agent.

MICROSOFT COPILOT

Powered by Microsoft Copilot and available in Teams, making it easy to use within your Microsoft 365 ecosystem.

PROCESS DATA ANALYTICS

Grayson TimeSeries prepares and validates your process data automatically, detects anomalies, makes forecasts and establishes correlations.

FAQ

Answers to help you get started faster.

Real stories from teams who streamlined their workflow and delivered more with less.

What batch, exchanger, and distillation data can Grayson analyze?

Grayson AI analyzes prepared historical time-series from batch reactors, shell-and-tube exchangers, and distillation columns when exported to one CSV or Excel file. Typical fields include batch ID, elapsed time, phase, reactor and jacket temperatures, setpoints, feed rate, recipe context, shell- and tube-side temperatures and pressures, prepared approach temperature and pressure drop, feed, reflux, reboiler steam, tray temperatures, and transition labels. Operating-state and maintenance markers strengthen comparable-period analysis.

Can Grayson compare batch trajectories by phase and recipe?

Yes. When batch ID, elapsed minutes, phase, recipe, and thermal signals are prepared in one file, Grayson AI can overlay selected batches, group by recipe or phase, and surface where trajectories diverge during feed, hold, or other labeled windows. It can flag which recorded signal leads a change. Reaction completion, safety margin, and product quality remain decisions for approved process methods and qualified review.

Can Grayson track exchanger approach temperature and pressure drop under comparable flow?

Yes. With prepared approach temperature, pressure drop, flows, inlet conditions, and operating-state labels, Grayson AI can filter to stable comparable periods, compare early and late windows, and quantify whether approach and pressure drop move together. Fouling, corrosion, leakage, and instrumentation issues still require physical and engineering investigation.

Can Grayson compare settling time and oscillation across feed transitions?

Yes. On event-aligned transition records, Grayson AI can overlay transitions and compare settling time, oscillation amplitude, and lead-lag across feed, pressure, and tray-temperature signals. The analysis surfaces windows for reviewing feed composition, controls, hydraulics, and instruments. Composition, purity, flooding, and operating safety stay with plant measurements and procedures.

How should historian, batch, laboratory, and maintenance records be aligned?

Export the needed tags and context, align timestamps, and combine them into one flat CSV or Excel file before upload. Include batch or event IDs, phase labels, recipe identifiers, prepared engineering columns such as approach temperature or reflux ratio, and maintenance markers when the question needs them. Document units and how calculated fields were created. Grayson AI does not connect live to historians or merge systems automatically.

Which process-safety and product-quality decisions stay in approved plant workflows?

Grayson AI compares prepared historical patterns and surfaces differences for review. Reaction completion, relief and interlock decisions, product disposition, purity acceptance, and safety assessments remain with approved plant methods, qualified personnel, and regulated workflows. Use the analysis as evidence for investigation, not as a substitute for those controls.