Power Generation & Electric Utilities

Self-Service Industrial Time Series Analytics for Power Generation and Electric Utilities

Find the patterns behind rising heat rate, unusual transformer temperatures, solar PV underperformance, trips, derates, and changing asset behavior before they turn into extended troubleshooting or another unanswered shift handoff. Grayson TimeSeries lets plant and utility engineers individually chat with historical operational data for quick insights with a deterministic and auditable AI agent.

Get answers, quickly, by chatting with your industrial process data inside Microsoft Teams.

Self-service industrial time series analytics

Ask Your Data. Get Answers Now. In Teams.

Get fast, trustworthy answers from your generation and utility operational data through conversation - no new dashboards, no coding, and no waiting for someone else.

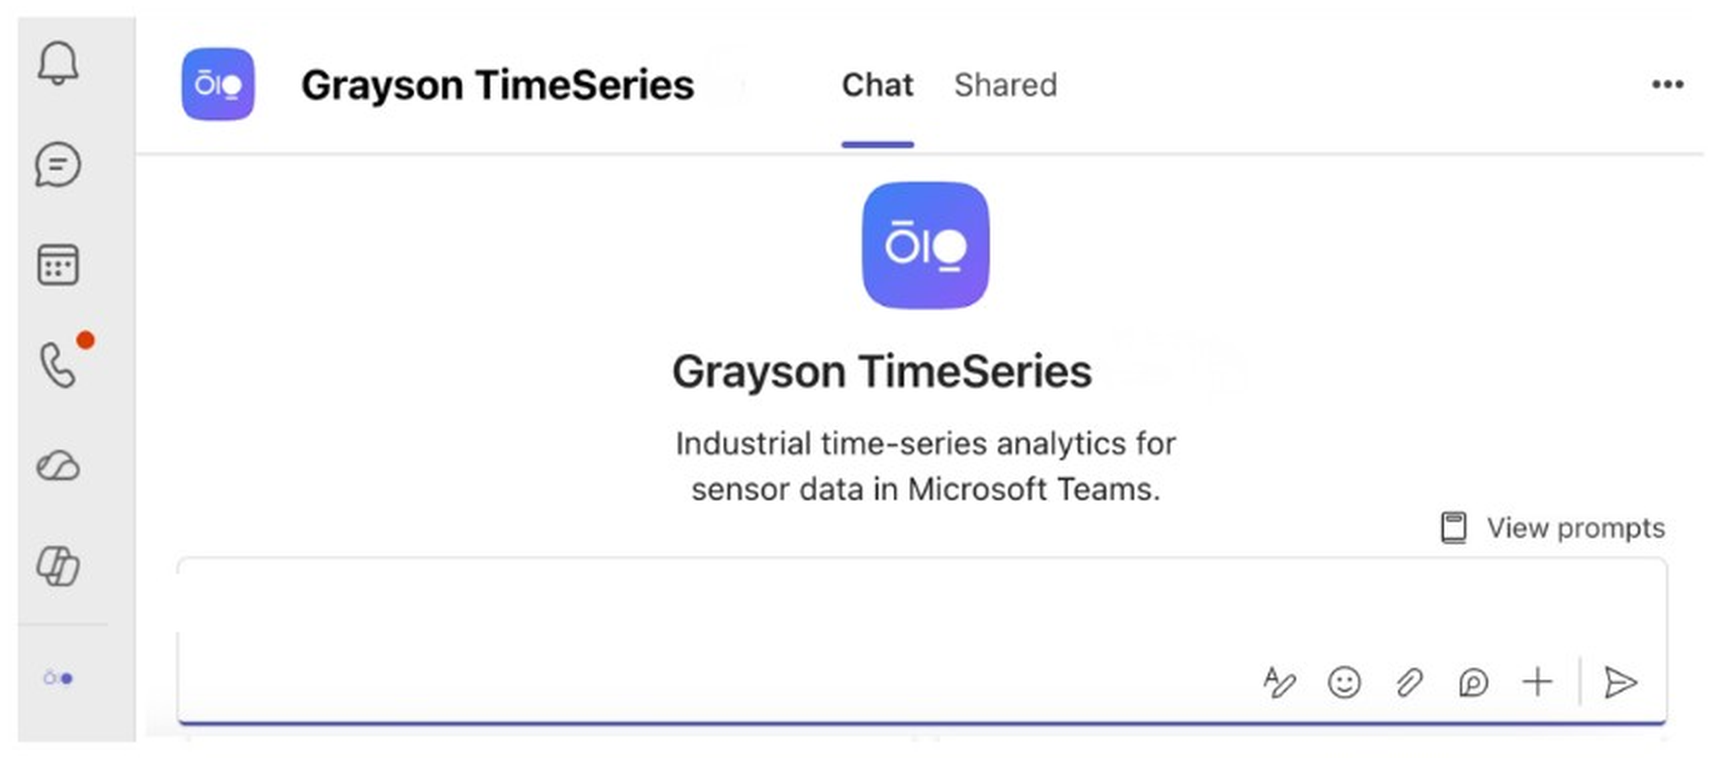
Grayson TimeSeries welcome screen in Microsoft Teams
Use Cases

The answers are already in your power-generation and utility data

Power plants and electric utilities are surrounded by DCS trends, historian exports, SCADA measurements, equipment states, inverter data, weather records, alarms, and maintenance events. The evidence behind an efficiency loss, an unusual thermal response, or a persistent performance gap can be buried across spreadsheets, dashboards, and shift notes.

Grayson TimeSeries Lite helps plant and utility teams ask direct questions of prepared historical data and get evidence-based answers backed by deterministic models.

Gas-Turbine Heat-Rate Degradation at Comparable Operating Conditions

The cost: A gradual increase in net heat rate means more fuel is required for the same electrical output. But load, ambient conditions, operating mode, fuel properties, and thermal stabilization can all change the result, leaving performance engineers to spend hours preparing and comparing trends manually.

What Grayson does: Analyzes a prepared dataset limited to comparable steady-state operation, including calculated net heat rate, generator output, ambient conditions, compressor discharge pressure and temperature, and documented maintenance events. Trend, anomaly, correlation, and period-comparison analysis can surface gradual performance changes and show whether a documented compressor wash coincided with recovery.

Ask Grayson: “Compare net heat rate, compressor discharge pressure, and compressor discharge temperature before and after the documented compressor wash. Did the historical performance relationship change?”

Outcome: Help the performance engineer distinguish a gradual efficiency trend from a sudden signal change and identify whether the pattern is consistent with recoverable compressor performance loss for further inspection.
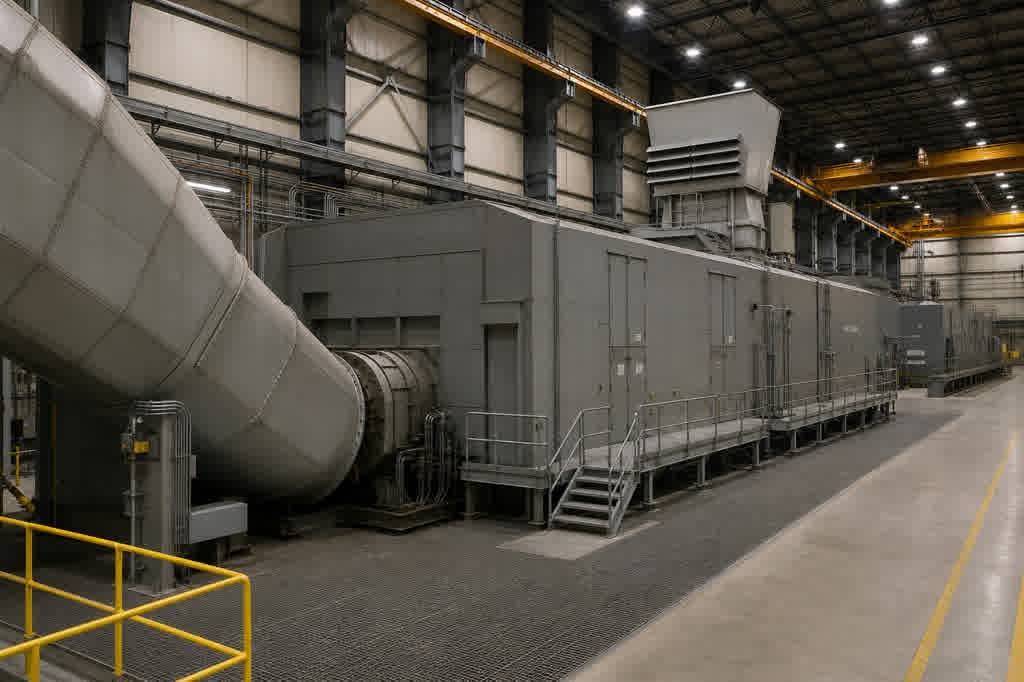
Heavy-duty gas turbine-generator train in a combined-cycle turbine hall

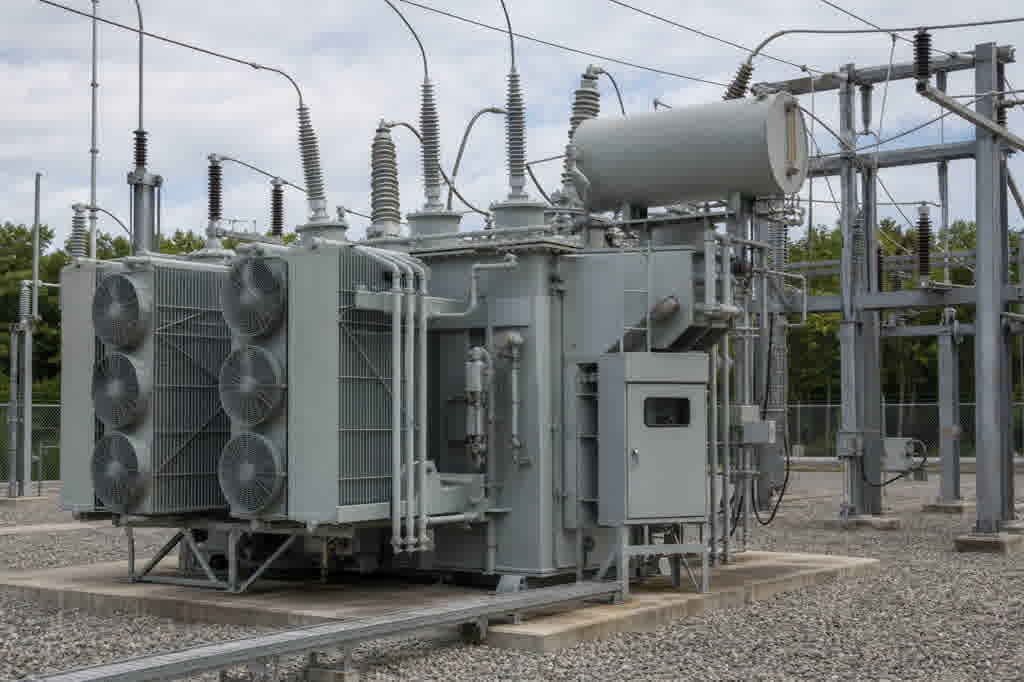
Power-Transformer Temperature at Comparable Loading

The cost: Higher-than-expected transformer temperature can reflect changing load, ambient conditions, cooling state, instrumentation behavior, or a developing equipment issue. Without a comparable baseline, normal thermal response and unusual behavior can look the same in a SCADA trend.

What Grayson does: Compares top-oil temperature, prepared top-oil rise over ambient, transformer loading, ambient temperature, and recorded cooling-fan or pump status across comparable operating periods. Anomaly, correlation, and lead/lag analysis can identify when the thermal relationship changed and whether the change coincided with a cooling-state or signal event.

Ask Grayson: “Compare top-oil temperature rise during these two similar high-load periods. When did the behavior become unusual, and did the change coincide with the recorded cooling-fan status?”

Outcome: Build a timeline showing when the thermal relationship changed and whether the change coincided with the recorded cooling state. Utility engineers can use that evidence to prioritize checks of fans, pumps, sensors, loading context, and maintenance history.

Oil-immersed power transformer with radiator banks in a high-voltage substation

Solar PV Block Underperformance Under Comparable Conditions

The cost: A solar block can produce less energy than a comparable reference block even when midday inverter clipping makes peak output look normal. The performance gap may remain hidden until the team compares unclipped periods, irradiance, temperature, and documented cleaning or maintenance events.

What Grayson does: Analyzes one prepared dataset containing comparable unclipped operating periods, plane-of-array irradiance where available, module temperature, inverter AC power, a reference block, prepared performance ratios, and a documented cleaning event. Trend and period-comparison analysis can show whether a gradual gap developed and whether performance recovered after cleaning.

Ask Grayson: “Compare Block 4 with the reference block before and after the documented cleaning event. Did the performance-ratio trend recover under comparable irradiance and module-temperature conditions?”

Outcome: Help the solar operations team determine whether the historical pattern is consistent with a recoverable surface-loss issue and identify periods for further inspection.

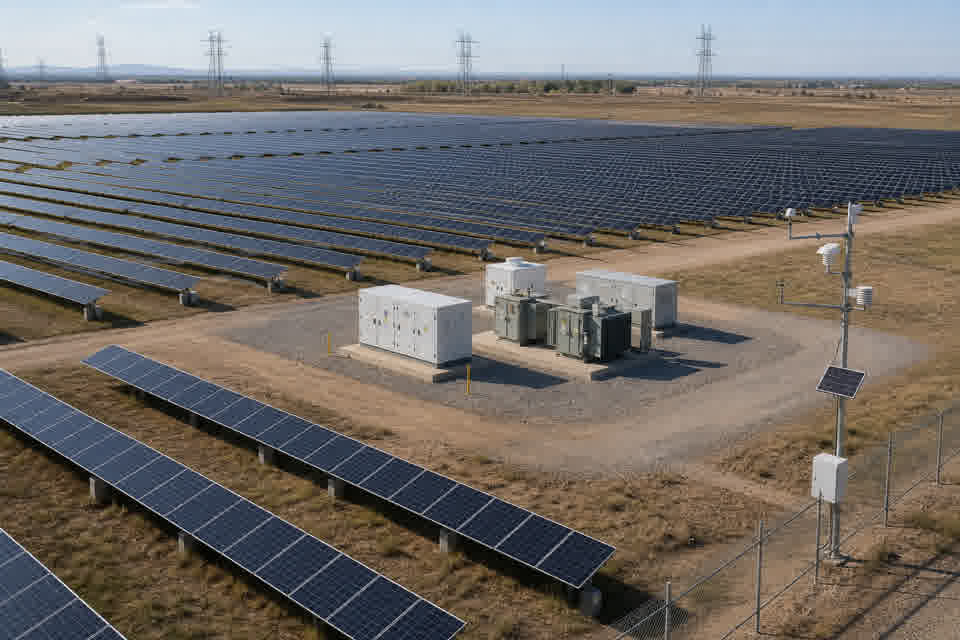
Utility-scale single-axis tracking solar PV facility with inverter skid

Grayson TimeSeries

Grayson TimeSeries is a Microsoft Teams app that lets engineers and operators individually chat with their industrial process data for quick insights with a deterministic and auditable AI agent.

MICROSOFT COPILOT

Powered by Microsoft Copilot and available in Teams, making it easy to use within your Microsoft 365 ecosystem.

PROCESS DATA ANALYTICS

Grayson TimeSeries prepares and validates your process data automatically, detects anomalies, makes forecasts and establishes correlations.

FAQ

Answers to help you get started faster.

Real stories from teams who streamlined their workflow and delivered more with less.

What is Grayson TimeSeries?

Grayson TimeSeries is an industrial time-series analytics app for Microsoft Teams. Plant and utility teams can upload CSV or Excel operational data, ask questions in natural language, investigate anomalies, correlations, lead/lag relationships, trends, forecasts, and operating-period comparisons, and create charts and reproducible reports without writing code.

How is Grayson TimeSeries different from traditional power-plant, SCADA, EMS, or historian analytics tools?

DCS, SCADA, EMS, historian, asset-management, and specialized engineering platforms remain essential for monitoring, control, storage, network analysis, dashboards, and established workflows. Grayson TimeSeries complements those systems by giving individual users a conversational way to investigate prepared historical exports inside Microsoft Teams. It does not replace real-time operations, dispatch, power-flow, protection, or reliability tools.

Can Grayson analyze data exported from my existing DCS, SCADA system, historian, or renewable monitoring platform?

Yes. If the source system can export time-stamped tabular data to CSV or Excel, you can upload a prepared file to Grayson TimeSeries for analysis. Data from separate systems, such as plant historian and weather data, should be aligned and combined into one file before upload when the investigation requires both.

Can Grayson investigate gas-turbine heat-rate degradation under changing operating conditions?

Yes, when the uploaded dataset contains calculated heat rate and has been prepared for a credible comparison, such as comparable load, ambient conditions, operating mode, and thermal state. Grayson can compare periods, identify trends and anomalies, and examine relationships among the supplied variables. OEM correction curves and ASME performance calculations must be prepared outside Grayson when required.

What transformer thermal and cooling signals can Grayson compare?

Grayson can compare transformer loading, top-oil temperature, ambient temperature, cooling-state signals, and prepared engineering variables across historical periods. It can identify unusual thermal relationships and event sequences that warrant inspection of fans, pumps, sensors, loading context, and maintenance history. Safe loading limits and insulation-life assessments remain with qualified utility engineering review.

Can Grayson help investigate solar PV block underperformance and inverter clipping?

Yes, when the uploaded file contains comparable inverter or block measurements and any required clipping flags, temperature corrections, or performance-ratio calculations have been prepared in advance. Grayson can compare blocks, investigate trends and anomalies, and show whether performance changed after a documented cleaning or maintenance event.