Pulp and Paper

Self-Service Industrial Time Series Analytics for Pulp and Paper Operations

Find the early warning signs in your digesters, refiners, paper machines, and recovery boilers before they become sheet breaks, lost freeness, or another unanswered shift handoff. Grayson TimeSeries lets engineers and operators individually chat with their industrial process data for quick insights with a deterministic and auditable AI agent.

Add Grayson TimeSeries to Teams

Get answers, quickly, by chatting with your industrial process data inside Microsoft Teams.

SELF-SERVICE INDUSTRIAL TIME SERIES ANALYTICS

Ask Your Data. Get Answers Now. In Teams.

Get fast, trustworthy answers from your industrial process data through conversation - no new dashboards, no coding, and no waiting for someone else.

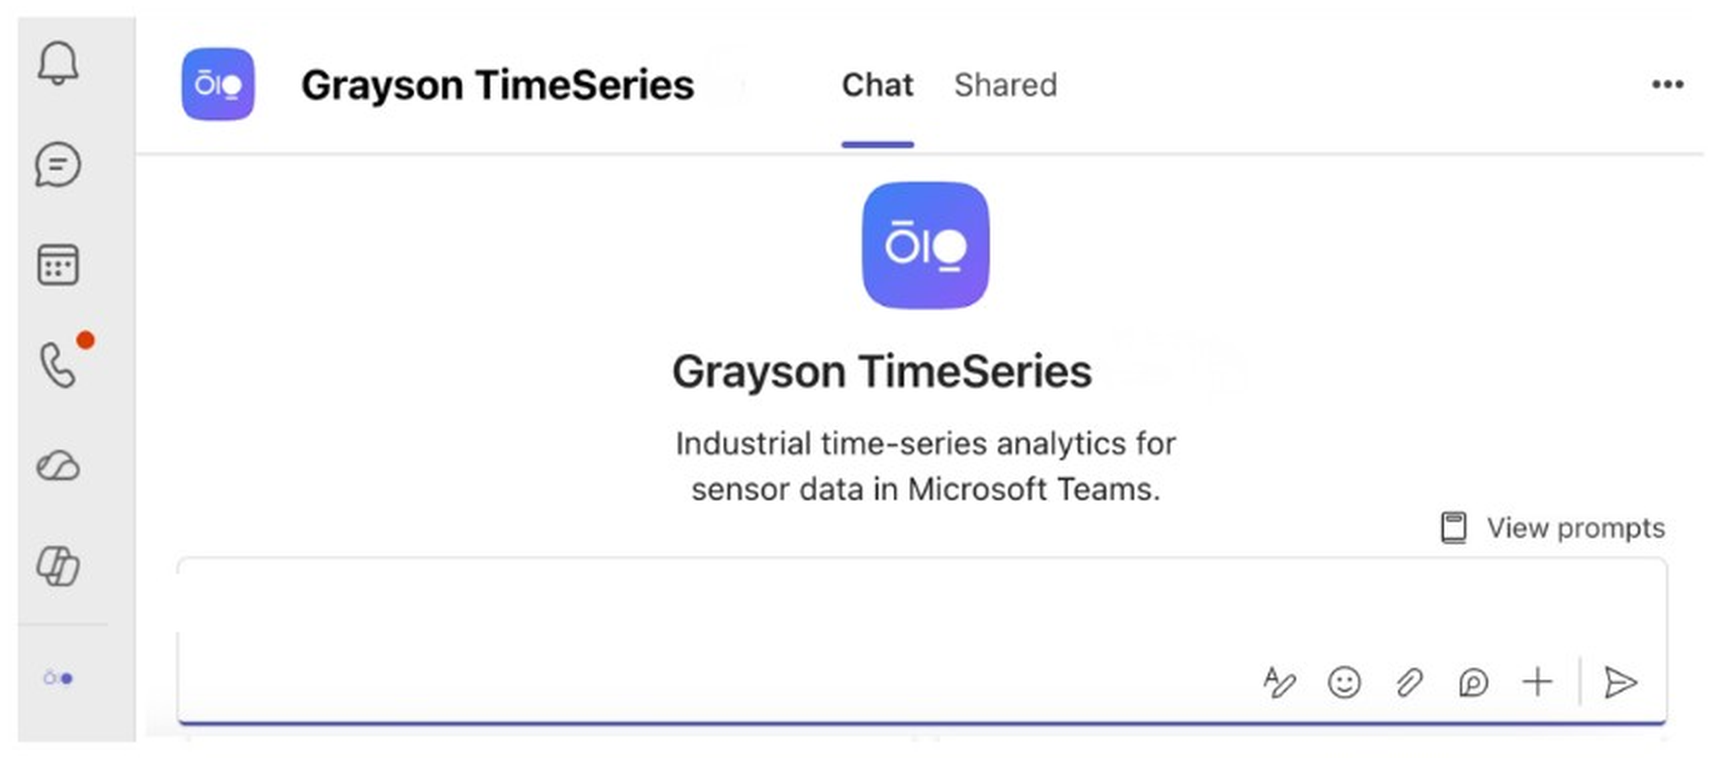
Grayson TimeSeries welcome screen in Microsoft Teams
Use Cases

The warning signs are already in your mill's historian data

Pulp and paper teams are surrounded by historian data, but the engineers and operators closest to the equipment rarely have time to manually trend every refiner, headbox, vacuum pump, drainage loop, and steam circuit signal. Early warning signs of hydraulic instability and chemical imbalance get buried in CSV exports, DCS trend screens, shift logs, and alarm noise.

Grayson TimeSeries Lite helps mill teams ask direct questions of that data and get evidence-based answers backed by deterministic models.

Refiner Plate Degradation and Stock Freeness Instability

The cost: Off-spec paper strength leading to downstream sheet breaks, wasted electrical energy and premature plate replacement or catastrophic "plate clashing."

What Grayson does: Tracks refiner motor power and current variance, vibration, hydraulic plate-gap clearance, inlet/outlet stock consistency, feed flow rate, and casing temperature differential to surface multi-variable signatures of plate bar wear, hydraulic feed instability, or fiber starvation.

Ask Grayson: “Here is the last 30 days of motor load, vibration, plate gap clearance, and inlet consistency for Refiner 3. Are the trends showing signatures consistent with plate bar wear or hydraulic feed instability?”

Outcome: Helps stock prep operators see whether a drop in pulp freeness is more consistent with feed consistency swings or with mechanical plate-wear patterns, supporting plate-change planning and clash risk review.
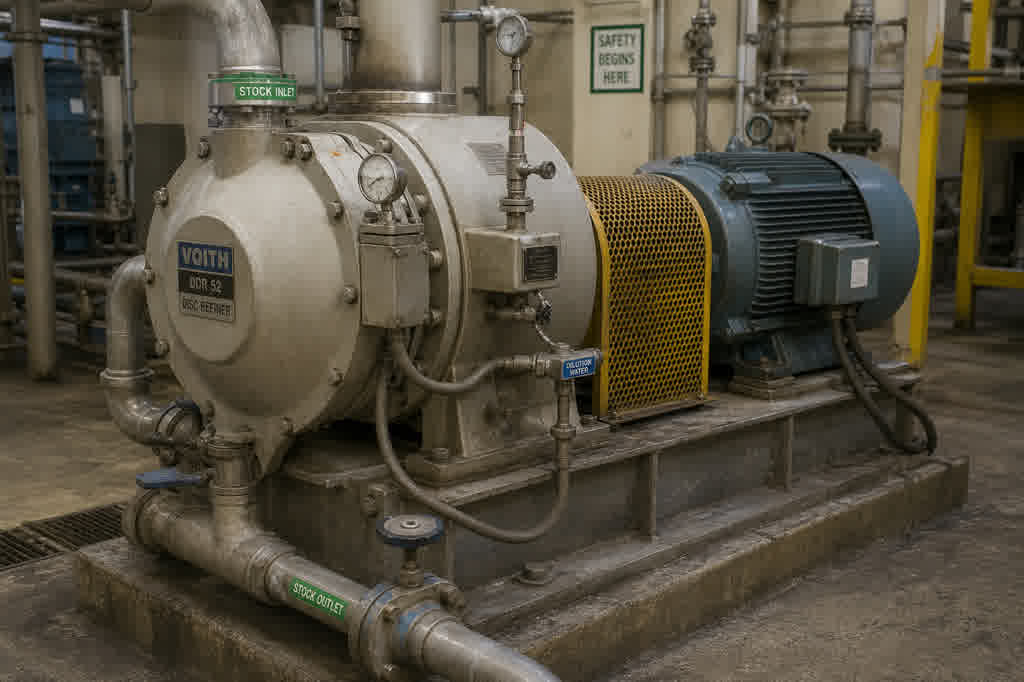
Disc refiner in a pulp mill

Wet-End Chemistry Variance and Sheet Break Risk

The cost: Massive production losses from web, broke reprocessing costs, wasted chemical additives, and operator burnout from constant thread-ups and cleanup.

What Grayson does: Analyzes headbox pressure stability, slice opening, retention aid dosing flow, white water consistency, pH, conductivity, turbidity, and couch roll vacuum levels to detect developing cyclic disturbances, chemical drainage imbalances, or furnish instability before the web breaks.

Ask Grayson: “Look at the headbox pressure, wire pit pH, retention aid flow, and couch vacuum tags over the last 12 hours on PM2. Is there an emerging cyclic disturbance or multi-variable oscillation correlated with our recent sheet breaks?”

Outcome: Helps paper machine operators shift from reactive sheet-break cleanup to earlier wet-end review by highlighting which dosing loop or hydraulic oscillation most closely tracks process variance.

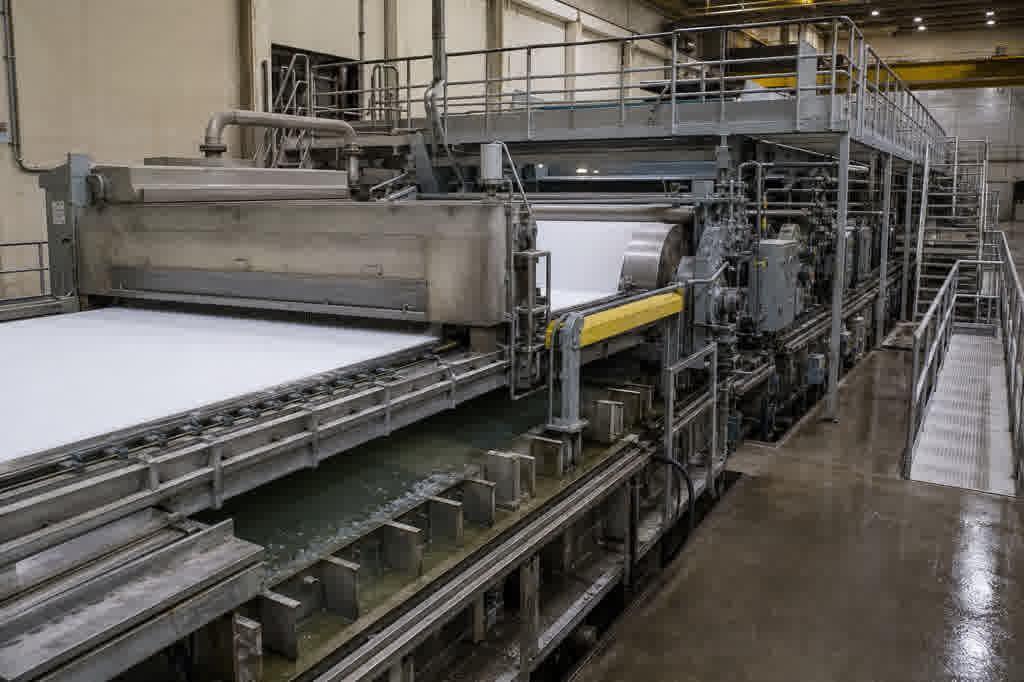
Paper machine wet end

Recovery Boiler Tube Fouling and Combustion Instability

The cost: Unplanned mill-wide shutdowns for boiler water-washing, excessive sootblower steam consumption, and severe thermal efficiency losses.

What Grayson does: Tracks black liquor firing rate, dry solids concentration, superheater tube skin temperatures, flue gas differential pressure across boiler banks, combustion air flow, and sootblower steam usage to quantify fouling rates and identify combustion zone instability.

Ask Grayson: “Here is 60 days of flue gas differential pressure, superheater temperatures, black liquor solids concentration, and sootblowing steam flow for Recovery Boiler 1. What is the current rate of tube fouling compared to baseline, and are sootblowing cycles effectively restoring clean-tube heat transfer?”

Outcome: Provides recovery area engineers with clear, data-backed evidence to review sootblowing schedules and estimate water-wash timing without relying on unplanned shutdowns or wasted high-pressure steam.

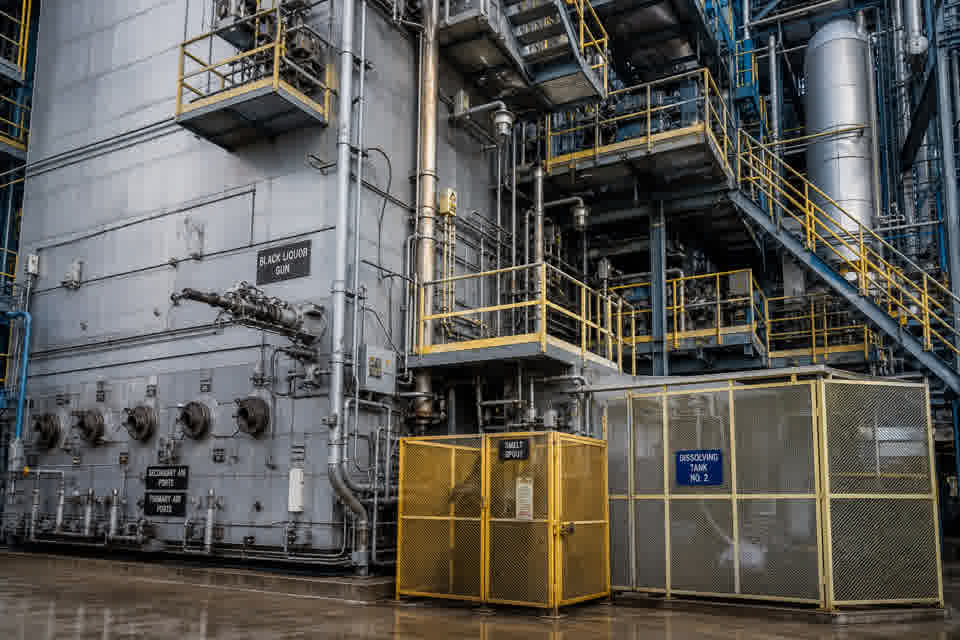
Recovery boiler at a pulp mill

Grayson TimeSeries

Grayson TimeSeries is a Microsoft Teams app that lets engineers and operators individually chat with their industrial process data for quick insights with a deterministic and auditable AI agent.

MICROSOFT COPILOT

Powered by Microsoft Copilot and available in Teams, making it easy to use within your Microsoft 365 ecosystem.

PROCESS DATA ANALYTICS

Grayson TimeSeries prepares and validates your process data automatically, detects anomalies, makes forecasts and establishes correlations.

FAQ

Answers to help you get started faster.

Real stories from teams who streamlined their workflow and delivered more with less.

What is Grayson TimeSeries?

Grayson TimeSeries is a self-service industrial time-series analytics agent available inside Microsoft Teams. Pulp and paper engineers and operators can upload exported mill data, ask questions in plain language, and receive deterministic analysis, visualizations, forecasts, correlations, and auditable reports without writing code or waiting for someone to build a new dashboard.

How is Grayson TimeSeries different from traditional historian analytics tools used in pulp and paper mills?

Traditional historians are excellent systems of record, but answering a new question often requires manually trending tags, configuring a new view, or asking an analytics specialist for support. Grayson complements your historian, DCS trends, dashboards, and existing analytics platforms by giving individual mill engineers and operators a conversational, self-service analytics layer inside Microsoft Teams. It does not replace the systems your mill already relies on.

Can Grayson analyze digester, refiner, paper machine, and recovery boiler data from my existing SCADA or historian?

Yes. Export the relevant time-series tags from your SCADA, DCS, or historian and upload the data to Grayson inside Microsoft Teams. Grayson can analyze data from digesters, refiners, stock preparation systems, headboxes, paper machines, vacuum systems, steam circuits, recovery boilers, and related mill utilities. Custom historian integrations can also be discussed with the Grayson team.

Can Grayson help with daily shift reports?

Yes. Grayson can summarize operating conditions, identify anomalies, compare the current shift with earlier shifts or a known baseline, and generate graphs and audit reports that can be shared during the shift handoff. Engineers and operators can then ask follow-up questions, such as what changed before a sheet break, when refiner performance began drifting, or when a recovery boiler fouling trend started to accelerate.

Can Grayson compare multiple signals across stock preparation and the paper machine?

Yes. Grayson can compare related variables across connected stages of the mill, for example, refiner motor load, plate gap, feed flow, stock consistency, and freeness against downstream headbox pressure, wet-end chemistry, vacuum, machine speed, and quality data. This helps mill teams assess whether an issue is isolated to one asset or whether upstream process instability is propagating into the paper machine.

Can Grayson analyze wet-end chemistry and sheet-break events together?

Yes. Grayson can compare headbox pressure, slice opening, retention-aid flow, white-water consistency, pH, conductivity, turbidity, couch vacuum, machine speed, and sheet-break timestamps. It can show which variables changed together and whether the same pattern repeats across multiple events, helping operators focus the investigation on furnish, chemistry, drainage, or hydraulic instability.

Can Grayson analyze recovery boiler fouling and sootblower performance?

Yes. Grayson can analyze black-liquor firing rate, dry-solids concentration, flue-gas differential pressure, superheater temperatures, combustion-air flow, and sootblower steam usage over time. Recovery-area teams can quantify the fouling trend, compare current performance with a clean baseline, and assess whether sootblowing cycles are restoring heat-transfer performance to support water-wash and outage planning.

Add Grayson TimeSeries to Teams