
Nothing Tripped, but Something Was Building: Crusher Overload or a Developing Mechanical Issue?
Use motor current, vibration, oil pressure, temperature, and feed rate to distinguish crusher overload from a developing mechanical issue.
In this article
On a mine site, the first sign of a developing mechanical problem is often an operator saying the crusher feels a little off, not an alarm going off.
The same pattern across three assets
In crushing, grinding, and slurry systems, wear often appears first as a slow change in the relationship between channels.
On a primary crusher, motor current and vibration may drift upward and grow noisier while lube oil pressure falls and oil temperature climbs, even though feed rate has barely changed. On a SAG mill, liner wear or bearing degradation can show up as power draw and bearing pressure moving against a steady feed rate and ore blend, well before throughput visibly suffers. On a slurry pump, impeller and liner wear can pull discharge pressure down while motor current and vibration rise, long before the duty point shifts far enough to be obvious.
In each case, figuring out what is happening means comparing several channels over weeks and deciding whether the movement is progressive or episodic. The analysis itself is not necessarily sophisticated. It is just time-consuming, especially when it has to be repeated across several assets.
A worked example
To show how this works, we used a demonstration dataset for Primary Crusher 2: fourteen days of ordinary historian data, exported and dropped straight into Grayson TimeSeries.
Primary Crusher 2: a worked example
Nothing in those fourteen days tripped an alarm. Across the back half of the window, motor current and vibration drifted upward and became noisier than they had been during the first week. At the same time, lube oil pressure fell, lube oil temperature climbed, and feed rate stayed steady.
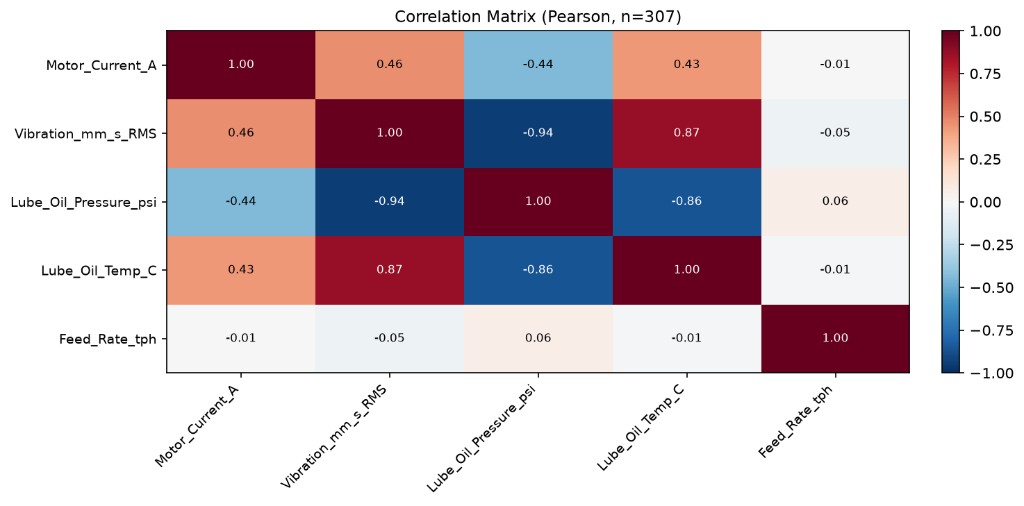
Primary Crusher 2 is a demonstration dataset built to illustrate the analysis. Real plant data is noisier; the method is the same.
Taken together, the pattern is consistent with a developing bearing or lubrication issue rather than a feed-driven overload. If the crusher were simply being pushed too hard, current and vibration would be expected to move with feed rate. Here, they did not.
Grayson surfaced the pattern and the charts behind it. It did not prescribe a maintenance action; it gave the operator a deterministic, auditable basis for deciding whether the hunch was worth escalating.
Ask the data directly
Grayson TimeSeries is a Microsoft Teams app that lets engineers and operators ask questions of industrial process data in plain language. The calculations are deterministic and auditable, and the results come back in the same Teams conversation.
The signals are already in your historian. Grayson makes them easier to investigate when something looks off.
Add Grayson TimeSeries to Microsoft Teams
Next step
Install, run a first analysis, or keep reading
Support covers setup in Microsoft Teams. The Knowledge Hub collects the worked examples and industry notes.