Z-Score vs IQR vs Isolation Forest: Choosing an Anomaly Detection Method for Process Data
TL;DR: Use Z-score for a quick, transparent screen of a stable, roughly bell-shaped signal. Use IQR when a few extreme readings would distort the average and standard deviation. Use Isolation Forest when the anomaly is an unusual combination across several signals, and only if you can check its extra flags against known events. Applying Z-score or IQR to many signals separately still judges each signal on its own; that does not make either method a multivariate detector.
Key takeaways
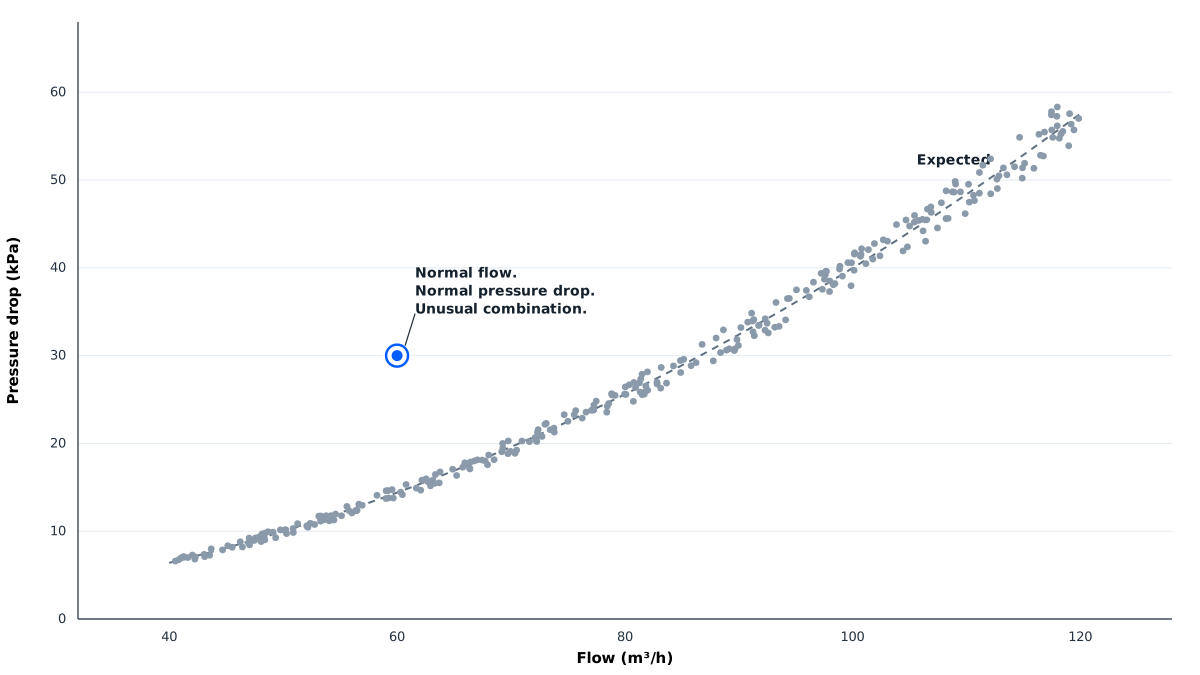
- A temperature spike is easy to see. A pressure reading that looks normal on its own, but unusual for the current flow, is harder.
- In their basic forms, these methods do not automatically understand sequence, startup, shutdown, product changes, or changing loads.
- Compare the methods against known events and review false alarms during healthy operation. Count useful investigations, not just flagged rows.
In this article
A temperature spike is easy to notice. A pressure reading that looks normal on its own, but unusual for the current flow rate, is harder to catch.
Both can be anomalies. They simply require different ways of looking at the data.
Z-score, interquartile range (IQR), and Isolation Forest are three common approaches to anomaly detection. For engineers working with process data, the choice comes down to what you need to detect: an extreme reading in one signal, or an unusual combination across several signals.
This page compares those three. Four ways to flag an anomaly is a separate article on the methods inside Grayson TimeSeries, including a variational autoencoder.
Z-score vs IQR vs Isolation Forest at a glance
| Question | Z-score | IQR | Isolation Forest |
|---|---|---|---|
| Best when | Z-scorea stable, roughly bell-shaped single signal | IQRwhen a few extreme readings would distort the mean and standard deviation | Isolation Forestunusual combinations across several signals, when flags can be checked against known events |
| What drives the flag? | Z-scoreDistance from the mean | IQRPosition beyond quartile-based fences | Isolation ForestEase of isolation by random splits |
| Typical input | Z-scoreOne signal at a time | IQROne signal at a time | Isolation ForestOne or several signals together |
| Main strength | Z-scoreSimple, interpretable deviation score | IQRLess affected by a few extreme values | Isolation ForestCan detect unusual combinations |
| Main limitation | Z-scoreMean and spread can be distorted | IQRCan overflag legitimate tails | Isolation ForestHarder to explain individual flags |
| Main sensitivity setting | Z-scoreZ-score cutoff | IQRIQR multiplier | Isolation ForestScore threshold and model settings |
| Repeatability | Z-scoreSame data, same result | IQRSame data, same result | Isolation ForestSame result only with a fixed random seed |
Applying Z-score or IQR separately to ten signals does not make either method a multivariate detector. Each signal is still being judged independently.
Z-score: How far is this reading from the average?
A Z-score measures how many standard deviations a value sits above or below the mean:
Z = (value − mean) / standard deviation
A common screening rule flags readings with an absolute Z-score greater than 3. That threshold is a starting point, not a universal definition of a fault.
Consider a hypothetical temperature signal with a baseline mean of 80°C and a standard deviation of 2°C. A reading of 88°C has a Z-score of 4 and would exceed that threshold.
Z-score is fast, easy to explain, and useful for screening a stable signal. However, extreme values can shift the mean and inflate the standard deviation, making other unusual readings harder to detect.
Small samples are a particular trap. When the mean and standard deviation come from the same readings, no Z-score can exceed (n − 1)/√n. With 10 or fewer readings, nothing can ever cross the |Z| > 3 threshold, no matter how unusual it is. [1]
A robust variant, the modified Z-score, replaces the mean and standard deviation with the median and the median absolute deviation (MAD). A commonly cited rule labels modified Z-scores above 3.5 as potential outliers. [1]
You can calculate Z-scores for non-normal data, but interpreting a three-standard-deviation threshold as a rare event is most defensible when the baseline is approximately normal and stable.
Practical fit: A single process variable fluctuating around a consistent operating level.
IQR: Is this reading outside the typical spread?
IQR uses quartiles rather than the mean and standard deviation.
The first quartile, Q1, is the 25th percentile. The third quartile, Q3, is the 75th percentile. Their difference describes the spread of the middle 50% of the data:
IQR = Q3 − Q1
A common rule flags values below Q1 − 1.5 × IQR or above Q3 + 1.5 × IQR. [2]
For example, suppose a pressure signal has Q1 = 4.8 bar and Q3 = 5.2 bar. Its IQR is 0.4 bar, giving screening limits of 4.2 and 5.8 bar. A reading of 6.1 bar would be flagged.
Because it relies on quartiles, IQR is less sensitive to a few extreme readings than a mean-and-standard-deviation approach. It also does not require a normal distribution. However, strongly skewed data can still produce many flags in a legitimate long tail.
IQR vs Z-score for outliers
Z-score flags distance from the mean, and extreme readings can shift that mean and inflate the standard deviation. IQR flags position beyond quartile fences, so a few extremes move it less, and it does not require a normal distribution. A Z-score threshold is most defensible when the signal is approximately normal and stable; strongly skewed data can still make IQR flag a legitimate long tail.
Practical fit: A simple, explainable screen for individual signals when extreme readings make the mean and standard deviation less representative.
Isolation Forest: How easily can this observation be separated?
Isolation Forest uses an ensemble of randomized trees. Each tree repeatedly selects a feature and splits its range. Observations isolated in fewer splits, on average, receive more anomalous scores.
It can work with one variable or several variables together and does not require labeled examples of failures. Turning its scores into flags still requires a decision threshold; settings such as contamination can influence that cutoff. An anomaly score is not a probability of equipment failure. [3]
Because the trees are randomized, scores can vary slightly between runs unless the random seed is fixed. Fix it whenever results need to be reproduced or audited. That repeatability is part of why process work needs a deterministic result you can stand behind. [3]
For a process engineer, its appeal is the ability to assess combinations such as temperature, pressure, flow, and vibration in the same observation.
A pressure reading may fall within its usual range. So may flow. Yet their combination may be unusual compared with the operating data used to fit the model. Isolation Forest can sometimes identify those cases, although detection depends on the features, data, and model settings.
Practical fit: Exploring unusual combinations across several process signals when separate limits do not capture enough context.
A heat exchanger example
Imagine reviewing temperature, pressure drop, and flow measurements from a heat exchanger.
A sudden temperature spike may be obvious with Z-score or IQR. A different event could involve a pressure drop that is ordinary across the full operating range but unusual at the current flow.
A multivariate Isolation Forest may flag that second observation even when separate limits do not. An engineering-derived feature, such as pressure-drop deviation from the expected value at a given flow, may make the event easier to detect and explain.
A flag alone does not establish fouling. It identifies a period worth investigating alongside operating conditions, instrumentation, and maintenance history.
For whether two signals move together, see Pearson vs. Spearman for process data. Sector notes for this heat exchanger example are on the oil and gas and chemicals and petrochemicals pages.
The limitation all three methods share: time and operating context
In their basic forms, these methods do not automatically understand sequence, startup, shutdown, product changes, or changing loads. Feeding Isolation Forest rows of sensor values does not teach it temporal behavior unless that information is represented in its inputs.
A healthy startup may look unusual compared with steady operation. A slow drift may remain inside broad limits while still mattering operationally.
Before comparing methods:
- Separate operating modes where practical.
- Check missing values, sensor errors, and timestamp alignment.
- Choose a baseline that represents the operation you intend to assess.
- Consider rolling features, rates of change, or deviations from expected behavior when timing matters.
- For future monitoring, evaluate on later data rather than randomly mixing neighboring timestamps.
A more complex algorithm cannot compensate for an unsuitable baseline.
When to use Z-score vs IQR vs Isolation Forest
Start with Z-score when you need a transparent screen for a stable, roughly bell-shaped signal.
Use IQR when you want a simple individual-signal check that is less influenced by a few extreme readings.
Evaluate Isolation Forest when unusual combinations across variables matter and you can validate whether its additional flags are useful.
Compare the methods against known events and review false alarms during healthy operation. If methods disagree, examine what each is measuring rather than assuming the majority is correct.
Count useful investigations, not just flagged rows.
Frequently asked questions
What is the difference between Z-score and IQR?
Z-score measures how many standard deviations a reading sits above or below the mean. A common screen flags an absolute Z-score greater than 3. IQR uses quartiles instead of the mean and standard deviation, and a common rule flags values below Q1 − 1.5 × IQR or above Q3 + 1.5 × IQR. Because it uses quartiles, IQR is less sensitive to a few extreme readings and does not require a normal distribution.
When should I use Z-score vs IQR for outliers?
Use Z-score for a transparent screen of a stable, roughly bell-shaped signal, such as one process variable fluctuating around a consistent operating level. Use IQR when a few extreme readings would make the mean and standard deviation less representative. Interpreting a three-standard-deviation Z-score as a rare event is most defensible when the baseline is approximately normal and stable.
How does Isolation Forest compare to Z-score for anomaly detection?
Z-score judges one signal at a time by its distance from the mean, and the same data gives the same result. Isolation Forest can look at one variable or several together, and it can sometimes flag an unusual combination even when each signal falls within its usual range. Its scores can vary between runs unless the random seed is fixed, and an anomaly score is not a probability of equipment failure.
What is Isolation Forest?
Isolation Forest uses an ensemble of randomized trees. Each tree selects a feature and splits its range, and observations isolated in fewer splits receive more anomalous scores. It can work with one variable or several together and does not require labeled examples of failures. Turning those scores into flags still requires a decision threshold.
Can Z-score or IQR detect unusual combinations across several signals?
No. Each method judges one signal at a time. Applying Z-score or IQR to many signals separately still judges each signal on its own, and that does not make either method a multivariate detector. A pressure drop that is ordinary across the full operating range can still be unusual at the current flow, and separate limits can miss that combination.
Do these methods account for time, startups, or changing operating modes?
Not in their basic forms. These methods do not automatically understand sequence, startup, shutdown, product changes, or changing loads. Feeding Isolation Forest rows of sensor values does not teach it temporal behavior unless that information is represented in its inputs. A healthy startup may look unusual compared with steady operation, and a slow drift may remain inside broad limits while still mattering operationally.
How do you compare all three on your own data?
Grayson TimeSeries runs Z-score, IQR, and Isolation Forest on your process data and records the method and parameters behind every flag, so you can see why a reading was flagged and rerun the same analysis later.
Upload a CSV or Excel export from your historian in ChatGPT, Claude, or Microsoft Teams, then ask:
"Compare Z-score, IQR, and Isolation Forest flags for outlet temperature, pressure drop, and flow over the last two weeks."
Sources
- NIST/SEMATECH e-Handbook of Statistical Methods: Detection of Outliers
- NIST/SEMATECH e-Handbook of Statistical Methods: Box Plot
- scikit-learn: IsolationForest
Next step
Try Grayson free, or keep reading
Ask your process data a question today.
Free. No credit card. Set up in under two minutes.
Use Grayson Free