Agriculture & Controlled Environment

Self-Service Time Series Analytics for Agriculture and Controlled Environments

Compare greenhouse microclimates, irrigation flow-pressure relationships, and recorded grain-bin cooling response without rebuilding the investigation in spreadsheets. Grayson TimeSeries lets growers, agricultural engineers, irrigation specialists, and storage operators analyze prepared historical sensor data inside Microsoft Teams.

Get answers, quickly, by chatting with your industrial process data inside Microsoft Teams.

Self-service industrial time series analytics

Ask Your Data. Get Answers Now. In Teams.

Get fast, trustworthy answers from your industrial process data through conversation - no new dashboards, no coding, and no waiting for someone else.

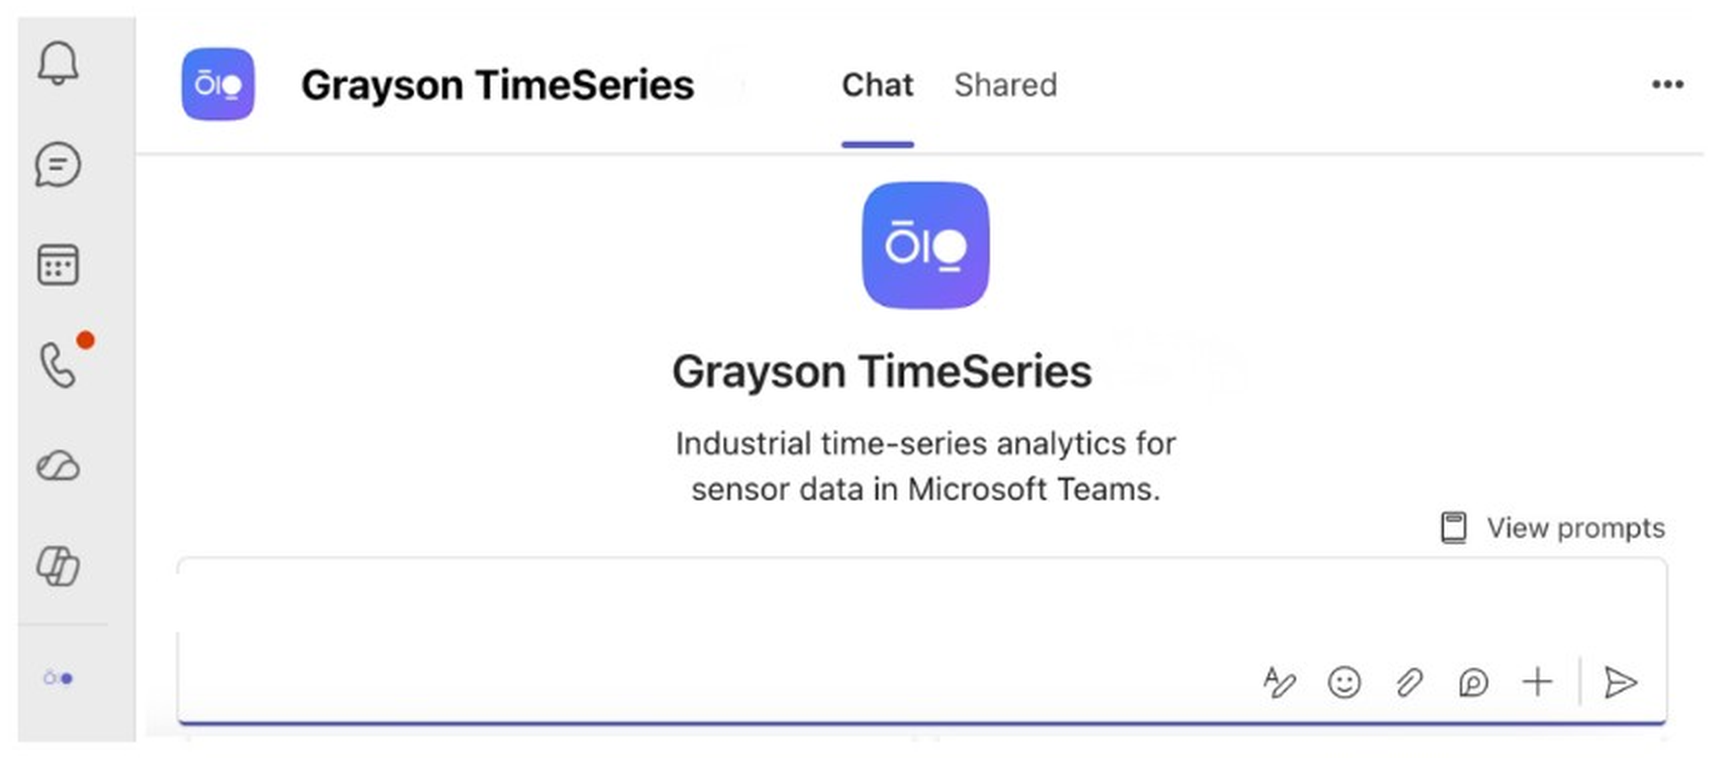
Grayson TimeSeries welcome screen in Microsoft Teams
Use Cases

The answers are already in your historical process data

Greenhouses, irrigation systems, and grain facilities generate temperature, humidity, VPD, pressure, flow, fan-state, pump, and vertical temperature-cable data. Useful evidence is often spread across controller exports and must be aligned with events and operating context before comparison.

Grayson TimeSeries helps the people closest to the problem ask direct questions of one prepared CSV or Excel file and receive evidence-based answers backed by deterministic, reproducible analysis.

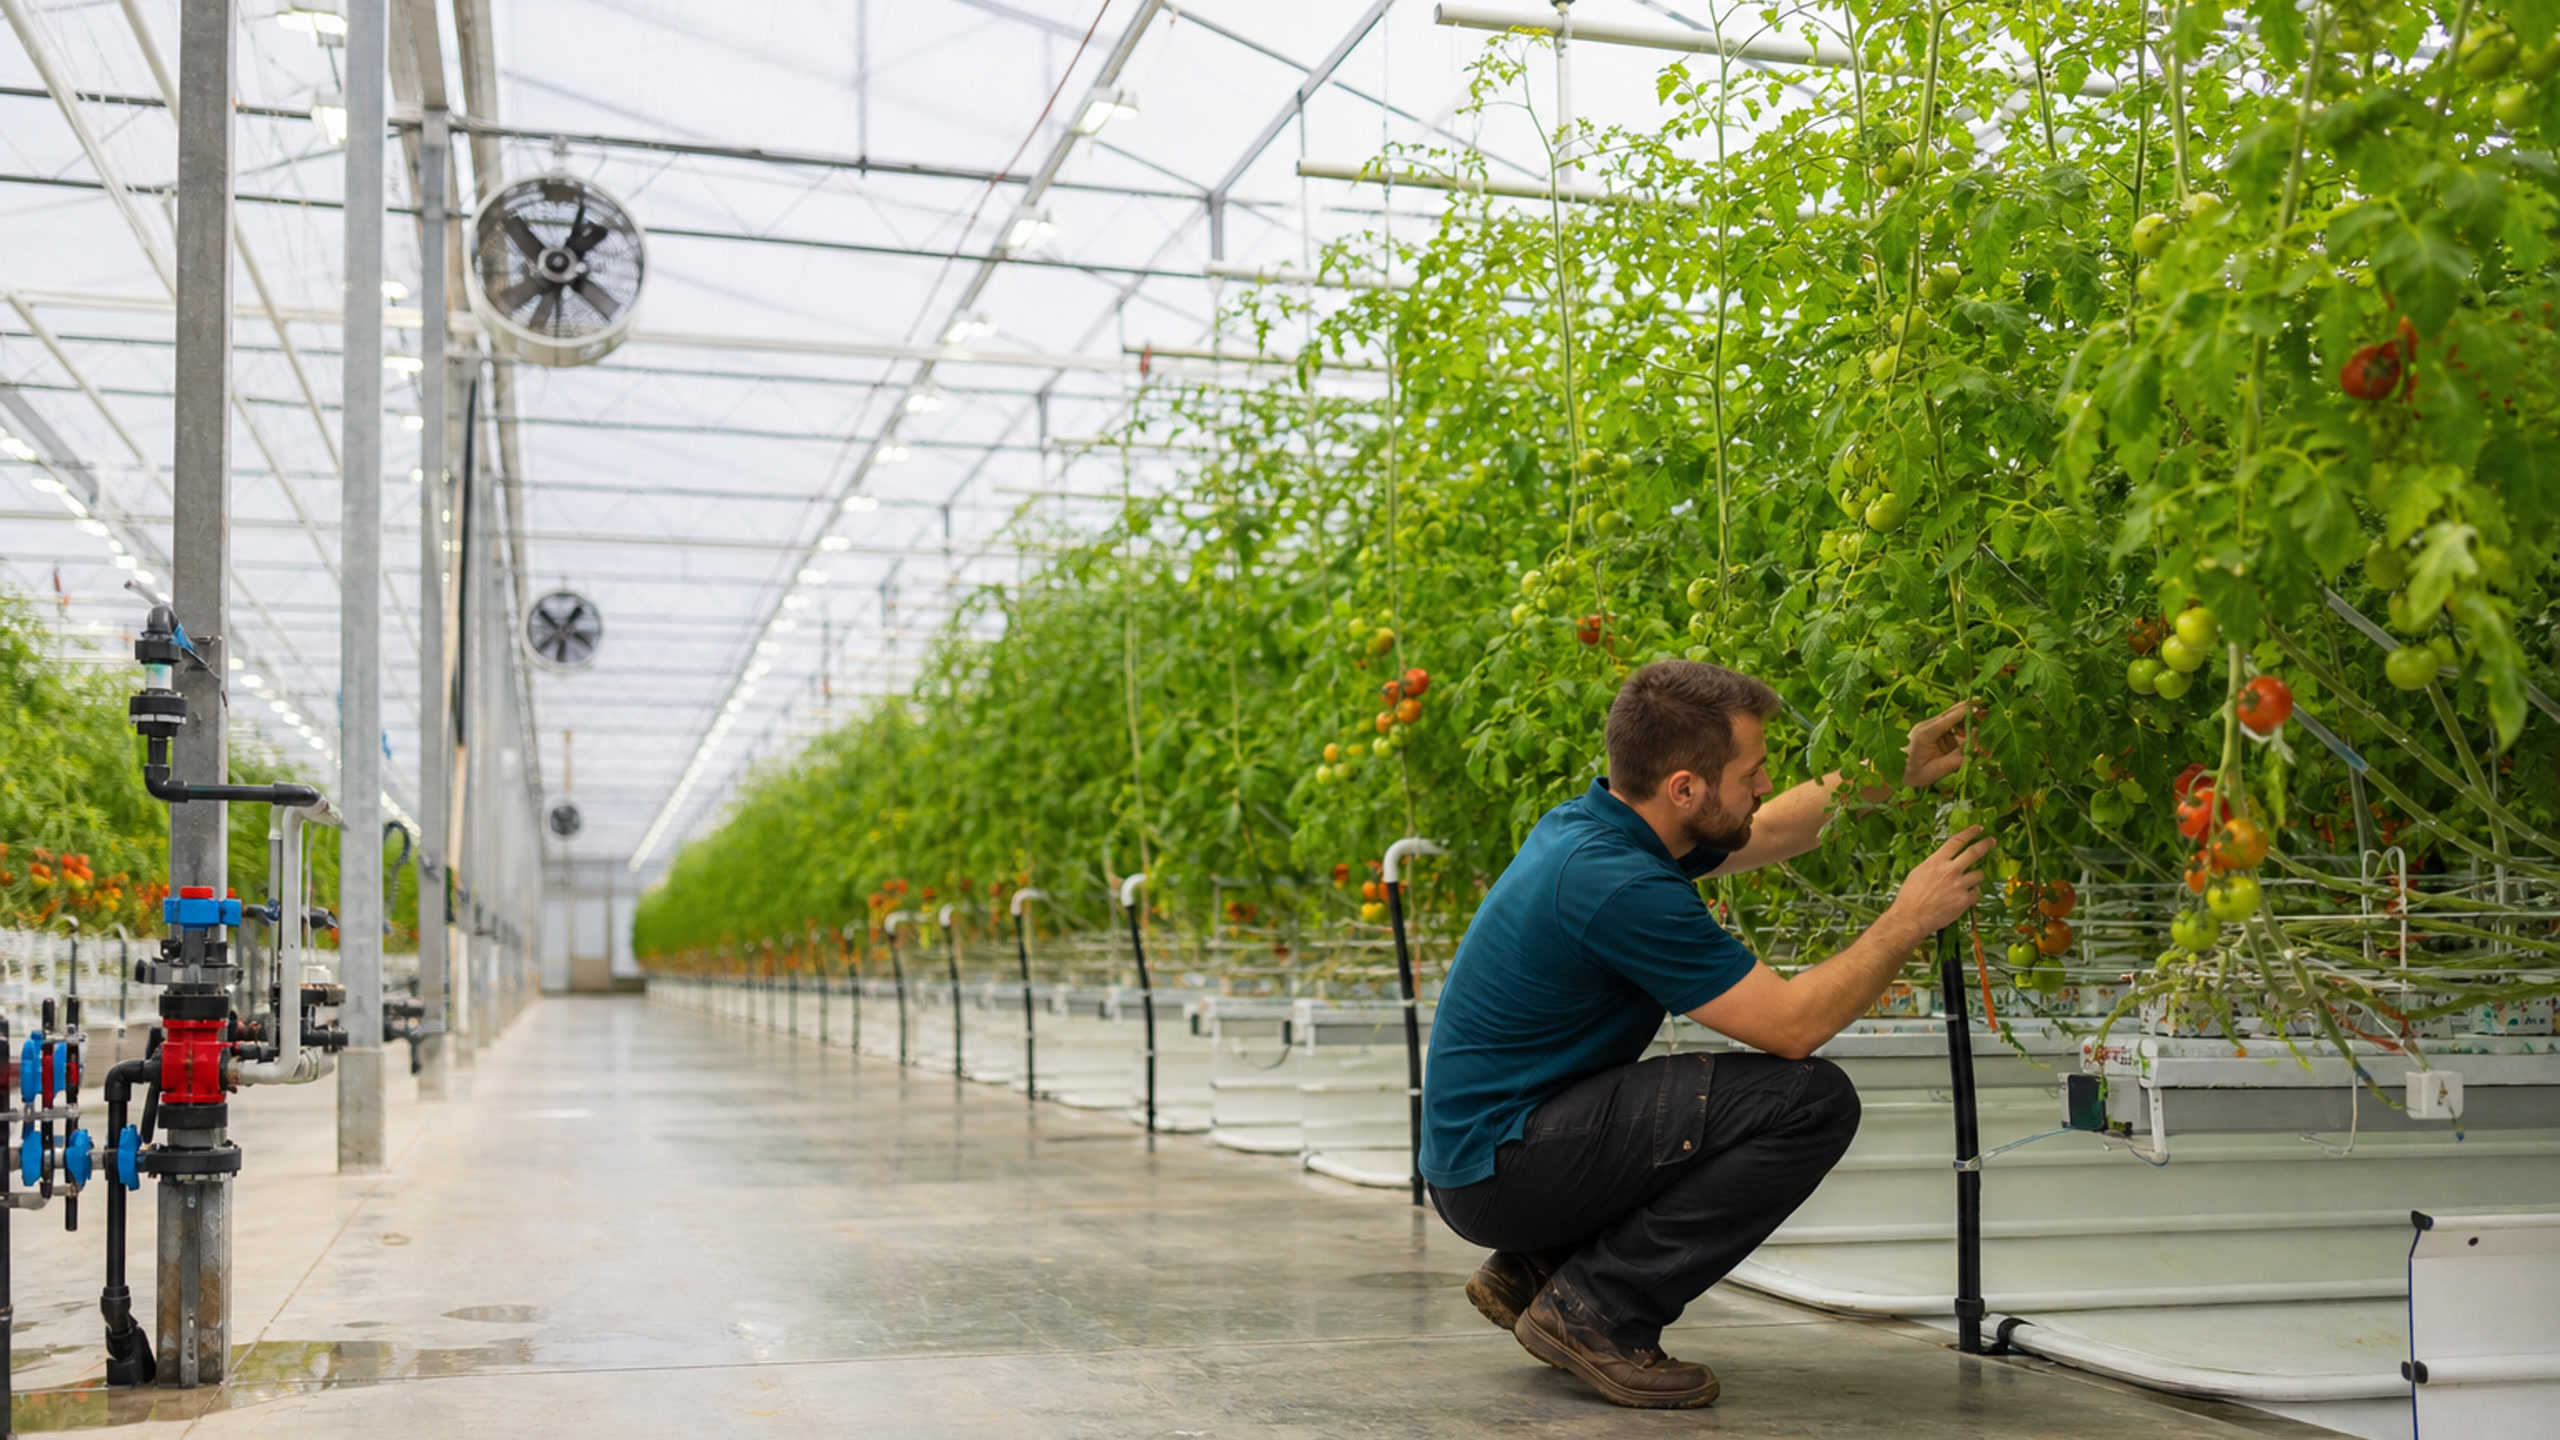
Greenhouse Spatial Microclimate Comparison

Why it is hard: Zone differences vary with weather, sensor placement, canopy stage, heating, ventilation, air mixing, and irrigation context. Air measurements do not directly measure leaf or root-zone condition.

What Grayson analyzes: A prepared multi-zone file with synchronized temperature, relative humidity, prepared VPD, outside air, heating command, ventilation state, bay, and crop-stage context.

Ask Grayson: “During night heating, compare Zone A with Zones B and C before, during, and after the selected deviation period. Which recorded variable changes first?”

Outcome: Help the grower focus review on sensor placement, heating response, air movement, curtains, vents, and zone context.
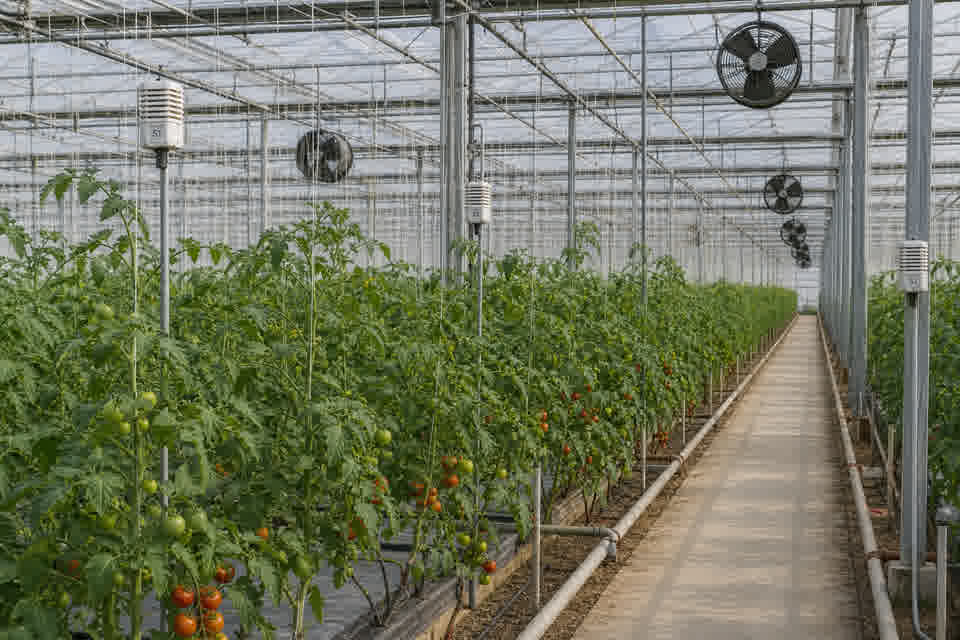
Commercial greenhouse bay with climate sensors, fans, and heating pipes

Irrigation Submain Flow-Pressure Deviation

Why it is hard: Pressure and flow depend on pump operation, valve response, filters, piping, emitter characteristics, block demand, measurements, and maintenance state. A declining flow ratio does not by itself prove emitter clogging.

What Grayson analyzes: Prepared event records with event ID, minutes from start, submain pressure, measured flow, prepared expected flow and flow ratio, valve feedback, pump power, and maintenance markers.

Ask Grayson: “Trend prepared flow ratio across events, compare pressure-flow correlation in early and late periods, and quantify the recorded response after the flush marker.”

Outcome: Give irrigation staff a defensible event list for checking meters, filters, valves, pumps, submains, flushing records, and field conditions.

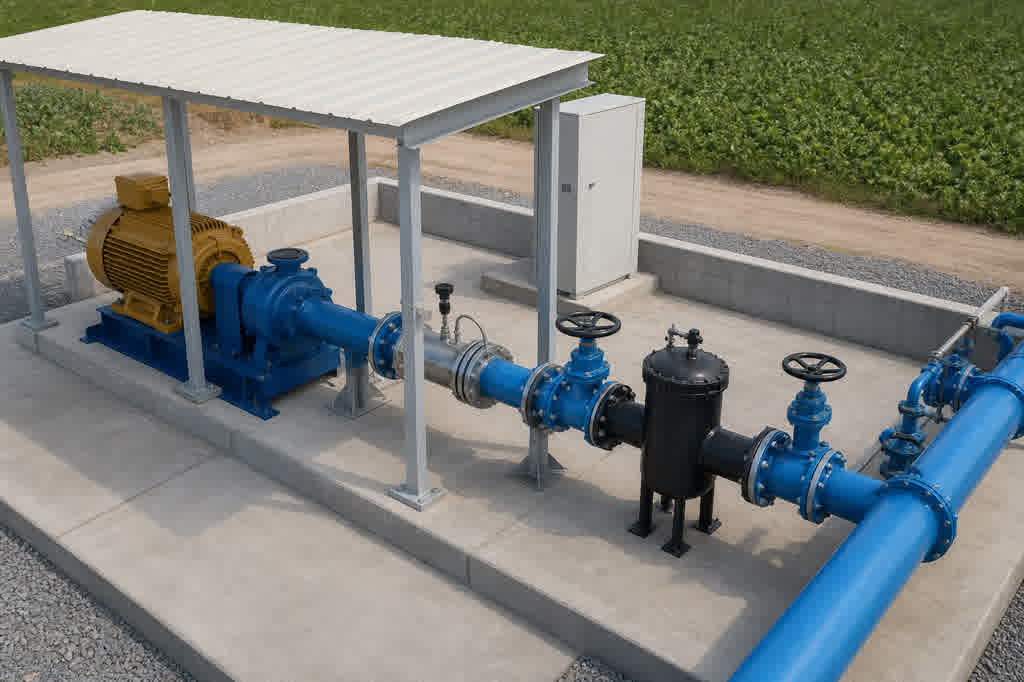
Irrigation pump and submain manifold with pressure and flow instruments

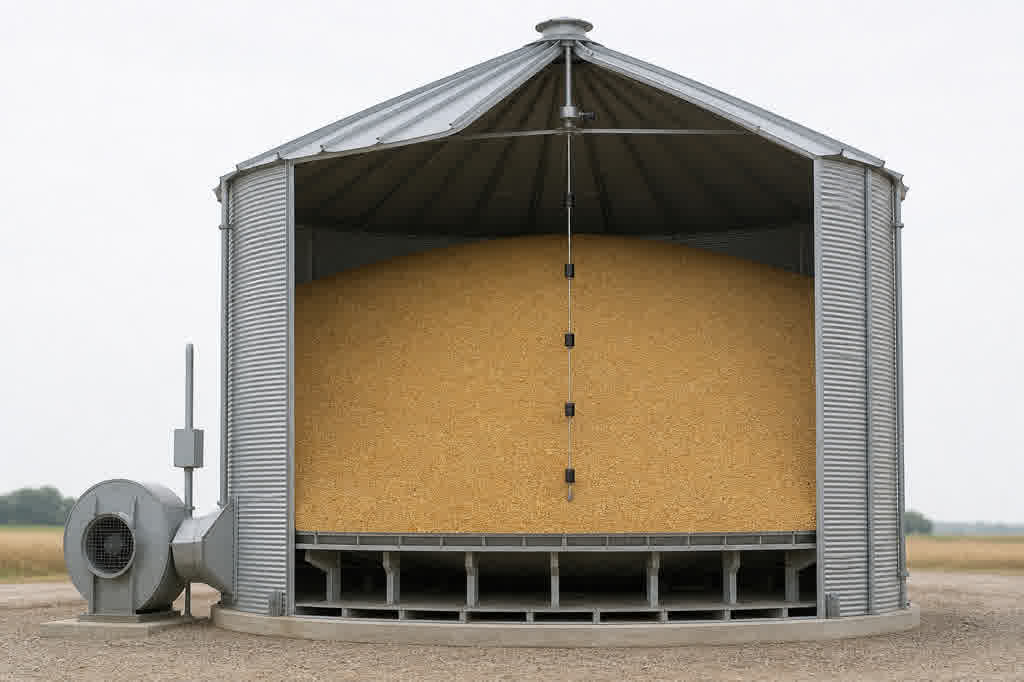
Grain-Bin Aeration Temperature Propagation

Why it is hard: The sequence depends on ambient conditions, fan performance, airflow path, grain properties, fill pattern, sensor location, and prior storage history. Temperature cables alone do not establish grain quality.

What Grayson analyzes: A prepared hourly file with ambient and plenum temperatures, multiple vertical cable nodes, fan state, prepared vertical temperature delta, and event context.

Ask Grayson: “Estimate the recorded lead-lag from plenum temperature to each cable node and compare the vertical temperature delta before, during, and after fan operation.”

Outcome: Help storage personnel surface sensor nodes and time windows for inspection, sampling, fan review, and operating-record reconciliation.

Commercial grain bin with aeration fan, plenum, and temperature cable

Grayson TimeSeries

Grayson TimeSeries is a Microsoft Teams app that lets engineers and operators individually chat with their industrial process data for quick insights with a deterministic and auditable AI agent.

MICROSOFT COPILOT

Powered by Microsoft Copilot and available in Teams, making it easy to use within your Microsoft 365 ecosystem.

PROCESS DATA ANALYTICS

Grayson TimeSeries prepares and validates your process data automatically, detects anomalies, makes forecasts and establishes correlations.

FAQ

Answers to help you get started faster.

Real stories from teams who streamlined their workflow and delivered more with less.

What greenhouse, irrigation, and grain-storage data can Grayson analyze?

Grayson AI analyzes prepared historical sensor and controller exports for greenhouses, irrigation systems, and grain facilities in one CSV or Excel file. Useful fields include zone temperature and humidity, prepared VPD, outside air, heating and ventilation state, submain pressure and flow, prepared expected flow and flow ratio, valve and pump signals, ambient and plenum temperatures, vertical cable nodes, fan state, and event markers.

Can Grayson compare VPD and climate conditions across greenhouse zones?

Yes. With synchronized multi-zone temperature, humidity, prepared VPD, and climate-control context, Grayson AI can compare zones before, during, and after selected periods and flag which recorded variable changes first. Include a prepared VPD column when VPD is part of the question, with the calculation method documented. Crop stress and disease judgments stay with the grower and agronomic review.

Can Grayson investigate changes in irrigation pressure and flow across events?

Yes. On prepared event records, Grayson AI can trend flow ratio, compare pressure-flow relationships across early and late events, and quantify recorded response after markers such as a flush. It surfaces a defensible event list for checking meters, filters, valves, pumps, and field conditions. Physical clogging or equipment failure still requires inspection.

Can Grayson estimate how recorded cooling moves through a grain bin?

Yes. With ambient and plenum temperatures, vertical cable nodes, fan state, and prepared vertical deltas, Grayson AI can estimate recorded lead-lag from plenum to each node and compare temperature response before, during, and after fan operation. Grain quality, cooling completion, and storage disposition remain site procedures, sampling, and qualified judgment.

How should weather, controller, pump, and sensor exports be combined?

Export each source, align timestamps, and combine the required fields into one prepared file. Include zone or block IDs, event IDs, minutes from start, prepared engineering columns such as VPD or flow ratio, and maintenance or flush markers when needed. Document units and calculation assumptions. Preserve missing values rather than inventing measurements. Grayson AI works from that prepared file, not from live multi-system connections.

Which agronomic and storage decisions remain with the site team?

Grayson AI compares prepared historical climate, irrigation, and aeration records and surfaces periods for review. Irrigation setpoints, crop actions, disease response, grain condition, aeration strategy, and storage release decisions stay with growers, agricultural engineers, and storage operators under site procedures. Use the charts and comparisons as investigation evidence, not as operating commands.