Food & Beverage Manufacturing

Self-Service Industrial Time Series Analytics for Food & Beverage Manufacturing

Find the patterns behind longer thermal runs, rising pressure drop, extended CIP phases, and recurring steam-pressure dips before they become another manual spreadsheet investigation or unanswered shift handoff. Grayson TimeSeries lets process, sanitation, utility, and maintenance teams analyze prepared historical plant data inside Microsoft Teams using deterministic and auditable methods.

Get answers, quickly, by chatting with your industrial process data inside Microsoft Teams.

Self-service industrial time series analytics

Ask Your Data. Get Answers Now. In Teams.

Get fast, trustworthy answers from prepared historical process and utility data through conversation, with no new dashboard, no coding, and no waiting for someone else to run the analysis.

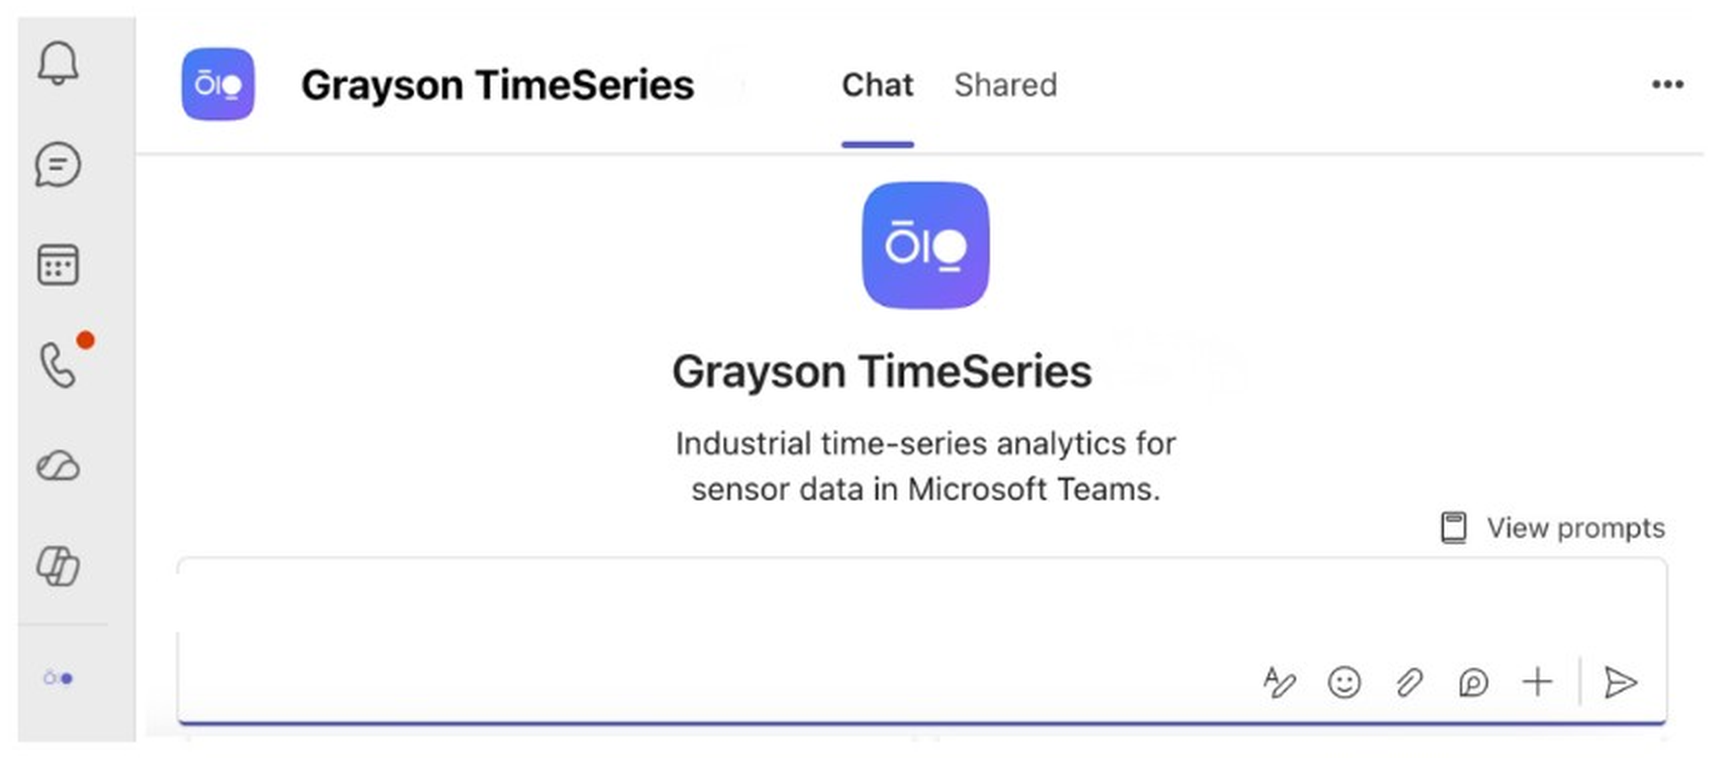
Grayson TimeSeries welcome screen in Microsoft Teams
Use Cases

The answers are already in your food and beverage process data

Food and beverage plants are surrounded by historian exports, PLC trends, CIP sequences, temperatures, flow rates, pressure measurements, equipment states, recipes, quality records, and utility data. The evidence behind a gradual thermal shift, a longer cleaning phase, or a recurring utility disturbance can be buried across multiple screens and spreadsheets.

Grayson TimeSeries helps the people closest to the problem ask direct questions of one prepared CSV or Excel file and receive evidence-based answers backed by deterministic, reproducible analysis.

Plate Heat Exchanger Thermal-Performance Drift

The cost: A thermal process can continue meeting its outlet-temperature target while demanding more heating-medium valve output or showing higher pressure drop. Without comparable product, flow, inlet-temperature, and steam conditions, the team may spend hours separating normal run variation from a persistent performance shift.

What Grayson does: Analyzes a prepared dataset containing product inlet and outlet temperatures, product flow, heating-medium valve output, section differential pressure, steam-supply pressure, recipe or SKU, production state, and any prepared normalized pressure metric. Trend, anomaly, correlation, and period-comparison analysis can show when the historical relationship changed and whether it persisted under comparable conditions.

Ask Grayson: “Compare the first and final three hours of this forward-flow production run under comparable product flow and steam-supply pressure. When did heating-valve output and normalized pressure drop begin moving away from the earlier baseline?”

Outcome: Help the process or maintenance engineer identify a defensible timeline for inspection of plates, sensors, steam supply, traps, valves, and operating context.
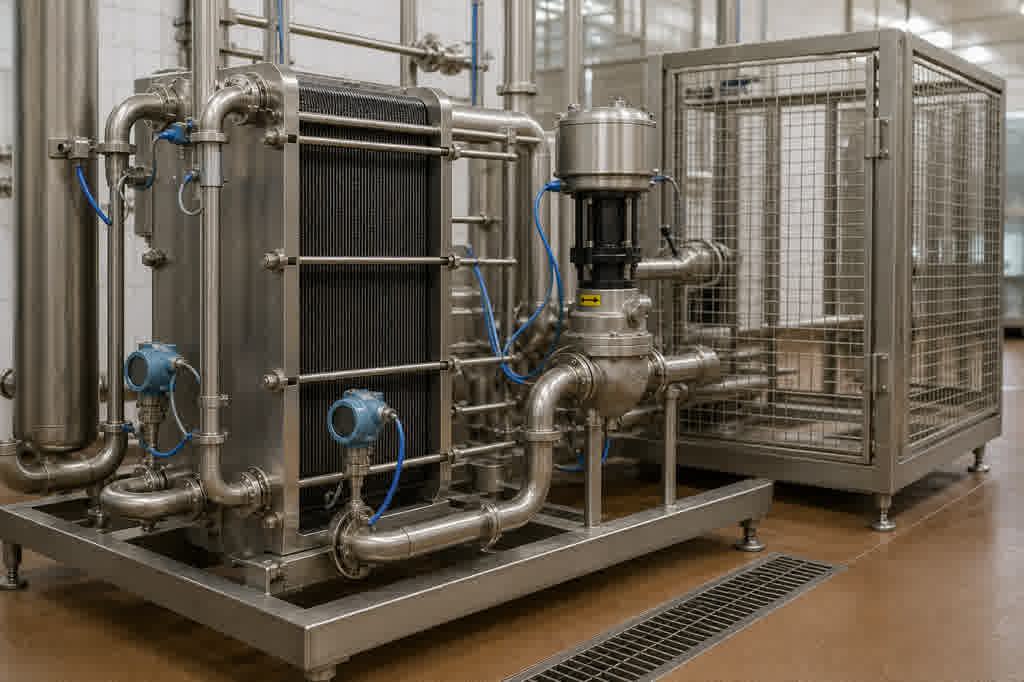
Sanitary multi-section plate heat exchanger skid in a food processing facility

Clean-In-Place Cycle and Phase Comparison

The cost: Longer-than-usual cleaning cycles can compress production schedules and increase utility or chemical use, but comparing raw PLC step numbers across multiple cycles is slow and can confuse programmed intent with the measured return conditions.

What Grayson does: Compares prepared CIP cycles containing mapped phase names, cycle IDs, supply and return temperatures, flow, conductivity, relevant setpoints, equipment circuit, recipe, and prepared phase durations. Descriptive statistics, anomaly detection, and period comparison can identify outlying cycles and show which measured signals differed during the extended phase.

Ask Grayson: “Compare the caustic-wash and final-rinse phases across these ten cycles on the same circuit. Which cycles ran longer, and how did return temperature and conductivity differ from the recent baseline?”

Outcome: Rank the cycles and phases that differ most from the recent baseline, then show how duration, return temperature, conductivity, and flow changed together. Sanitation and operations teams can use that comparison to focus their review of recipes, valves, pumps, sensors, and recorded interventions.

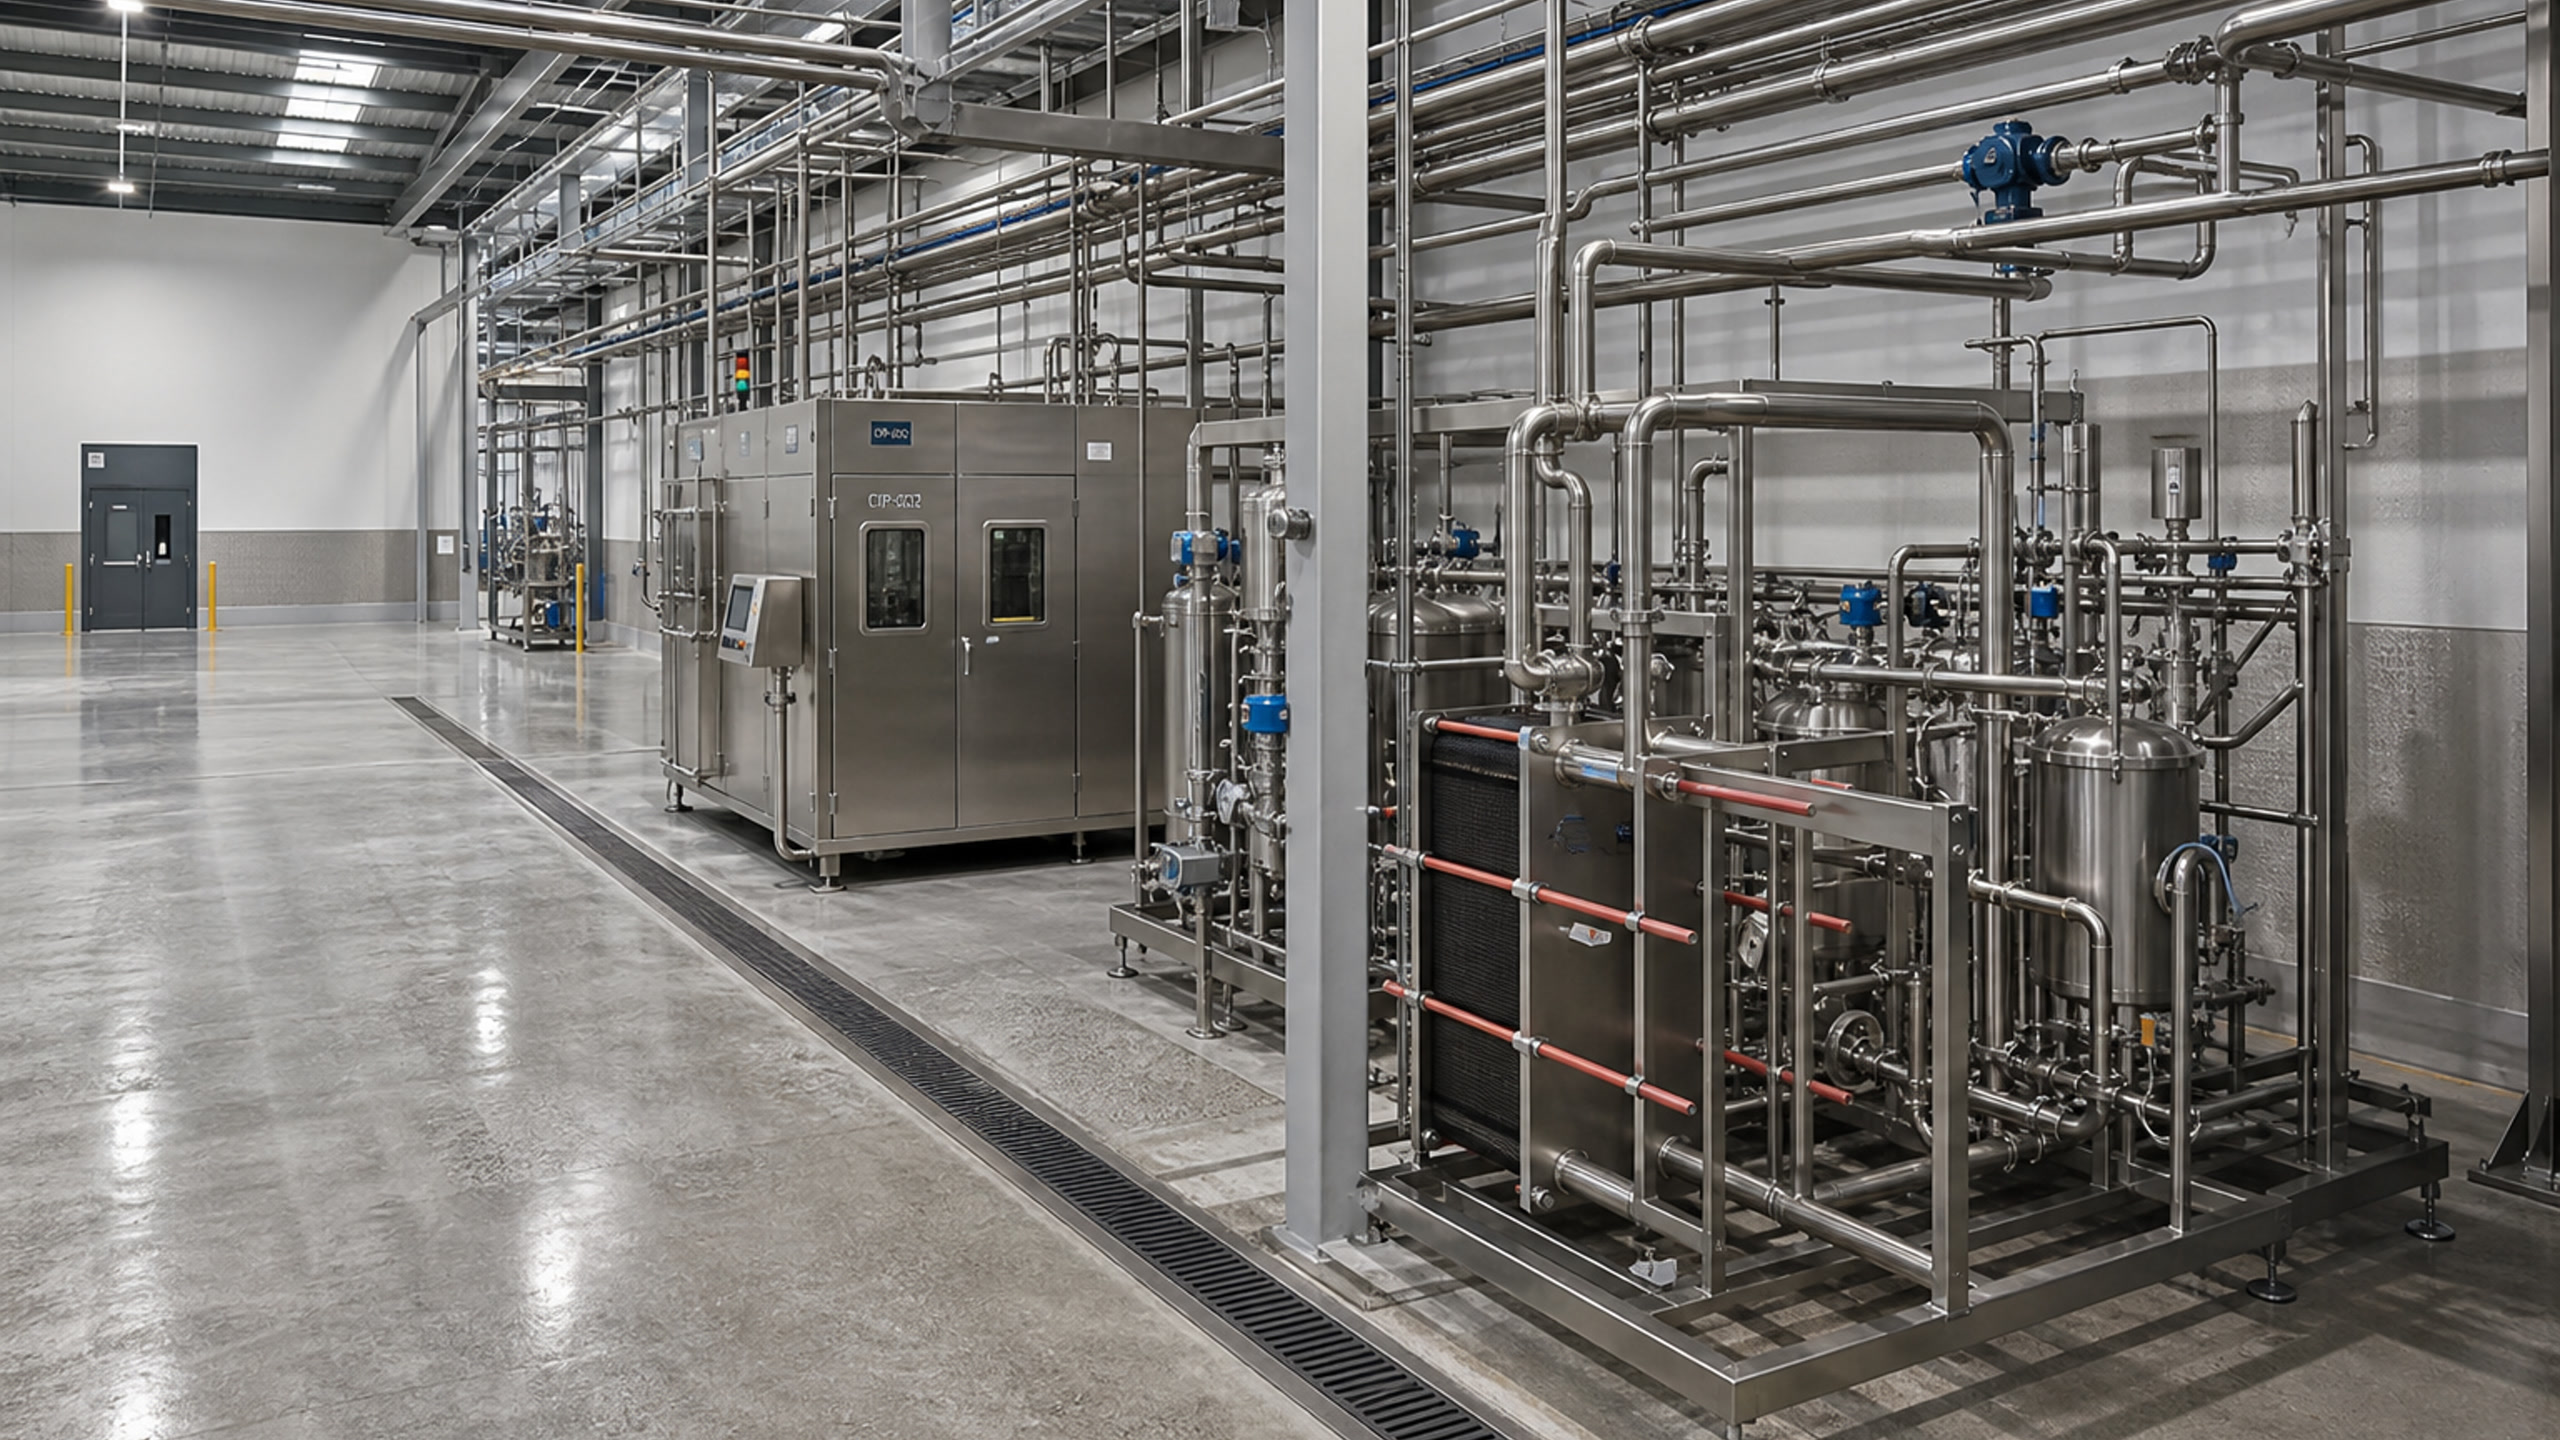
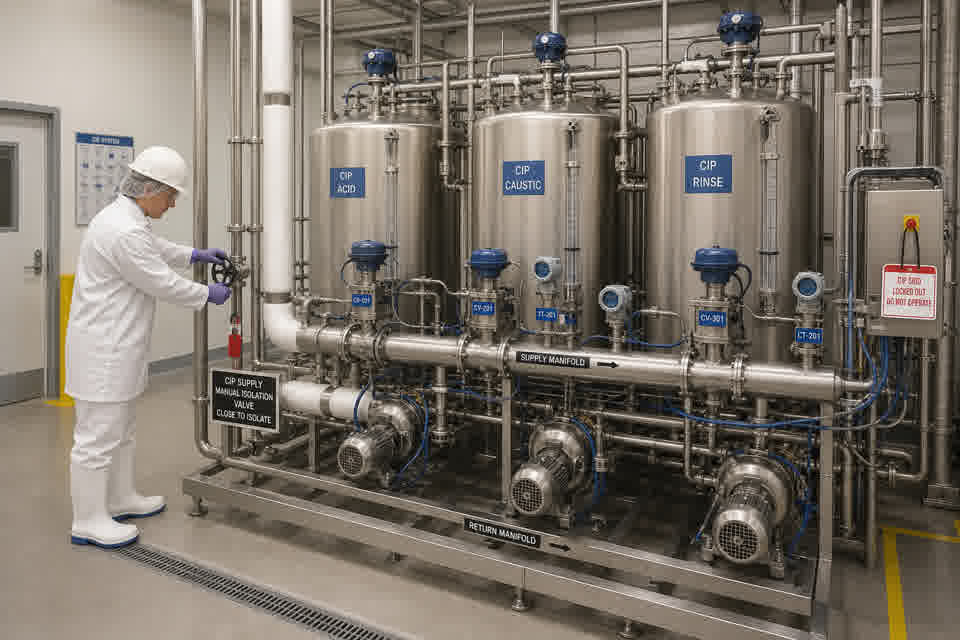
Automated food-plant CIP skid with stainless solution tanks and sanitary manifolds

Steam-Header Pressure During Coincident Process Loads

The cost: A plant-wide pressure dip can disrupt pasteurizers, retorts, kettles, dryers, or CIP heating, yet the cause may be difficult to reconstruct when boiler data and downstream valve signals are reviewed separately after the shift.

What Grayson does: Analyzes one prepared, time-aligned file containing header pressure, boiler firing rate, total steam flow where available, downstream valve outputs, production state, shift context, and a prepared coincident-load count. Correlation, lead-lag analysis, anomaly detection, and operating-period comparison can show which recorded demand patterns are associated with the pressure events.

Ask Grayson: “For each low-pressure event in this dataset, compare the preceding 20 minutes of boiler firing rate, total steam flow, and the three downstream steam-valve outputs. Which load combinations recur most often?”

Outcome: Help utility and process teams prioritize operating-sequence, instrumentation, regulator, trap, boiler-response, and distribution-system checks.

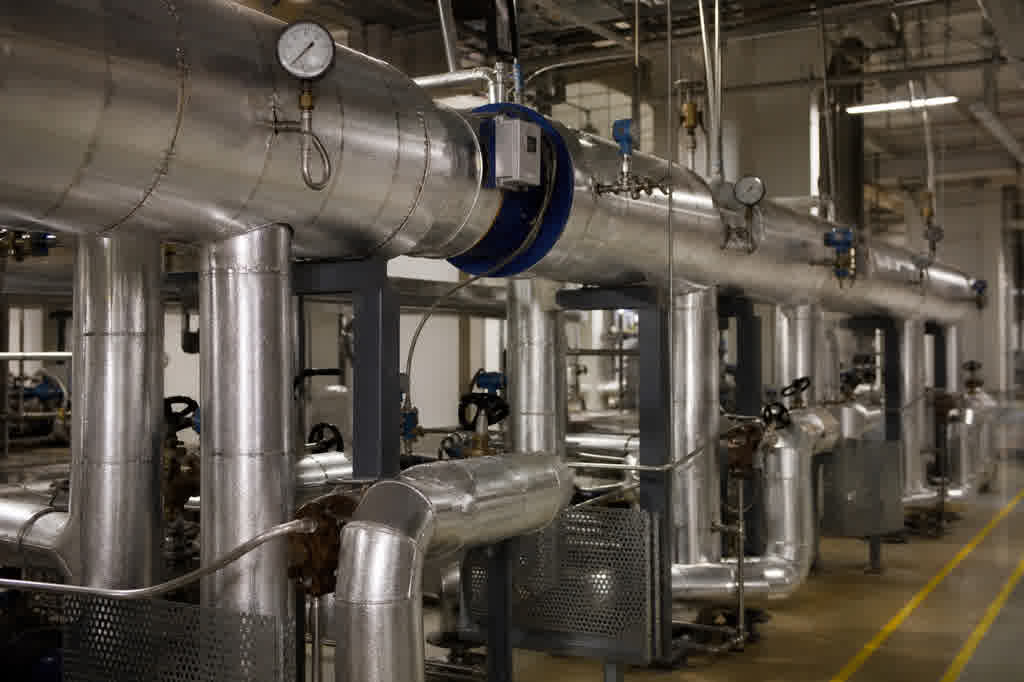
Central industrial steam distribution header in a food manufacturing plant

Grayson TimeSeries

Grayson TimeSeries is a Microsoft Teams app that lets engineers and operators individually chat with their industrial process data for quick insights with a deterministic and auditable AI agent.

MICROSOFT COPILOT

Powered by Microsoft Copilot and available in Teams, making it easy to use within your Microsoft 365 ecosystem.

PROCESS DATA ANALYTICS

Grayson TimeSeries prepares and validates your process data automatically, detects anomalies, makes forecasts and establishes correlations.

FAQ

Answers to help you get started faster.

Real stories from teams who streamlined their workflow and delivered more with less.

What is Grayson TimeSeries?

Grayson TimeSeries is a no-code industrial time-series analytics application for Microsoft Teams. Upload one prepared CSV or Excel file, ask questions in plain language, investigate anomalies, correlations, lead-lag relationships, trends, forecasts, and operating periods, and create reproducible charts and reports.

How is Grayson different from a plant historian, SCADA system, MES, or quality platform?

Those systems remain essential for data collection, monitoring, control, production execution, quality records, dashboards, and established plant workflows. Grayson complements them by giving individual users a conversational way to investigate prepared historical exports inside Microsoft Teams. It does not replace real-time control, statutory records, or specialized engineering tools.

Can Grayson analyze data exported from my existing food or beverage systems?

Yes, when the required time-stamped data can be exported and prepared as one suitable CSV or Excel file. Data from separate PLCs, historians, CIP systems, laboratory systems, quality records, or utility systems must be aligned and combined before upload. Availability depends on the equipment, logging configuration, installed sensors, and export permissions.

Can Grayson compare CIP cycles and cleaning phases?

Yes, when each cycle and phase is already identified in the uploaded file. Numeric PLC steps should be mapped to clear phase names, and phase boundaries, cycle IDs, equipment circuits, recipes, and any required duration calculations should be prepared before upload. Grayson can compare the historical patterns so sanitation teams can focus review of recipes, valves, pumps, sensors, and recorded interventions.

What plate heat-exchanger signals can Grayson analyze for thermal-performance drift?

Grayson can analyze recorded temperatures, flow, pressure drop, valve output, steam pressure, and prepared engineering metrics to identify historical drift and unusual periods under comparable conditions. Any normalized pressure ratio, heat duty, overall heat-transfer coefficient, or fouling factor must be calculated before upload. Physical condition still requires qualified inspection and engineering review.

What operational history can Grayson analyze alongside food-safety and release workflows?

Grayson supports historical operational investigation and reporting on prepared process, CIP, and utility data. Thermal lethality validation, legal or regulatory compliance, product safety, sanitation approval, laboratory testing, and process-control decisions remain with approved plant methods and qualified personnel.