
Automotive & Industrial Equipment Manufacturing

Self-Service Industrial Time Series Analytics for Automotive and Industrial Equipment Manufacturing

Find the patterns behind changing CNC spindle load, unusual prepared weld signatures, and recurring compressed-air load and pressure behavior before they become another manual export review or unresolved production investigation. Grayson TimeSeries helps manufacturing engineers, controls teams, reliability specialists, and operations personnel analyze prepared historical data inside Microsoft Teams using deterministic and auditable methods.

Get answers, quickly, by chatting with your industrial process data inside Microsoft Teams.

Self-service industrial time series analytics

Ask Your Data. Get Answers Now. In Teams.

Get fast, trustworthy answers from prepared historical machine, controller, MES, quality-context, energy, and utility data through conversation, with no new dashboard, no coding, and no waiting for another analysis queue.

Grayson TimeSeries welcome screen in Microsoft Teams
Use Cases

The answers are already in your manufacturing data

Automotive and industrial-equipment plants generate controller trends, CNC program and tool context, drive loads, weld summaries, machine states, MES records, energy meters, utility pressure, alarms, maintenance events, and quality results. High-frequency signals and separate system exports often need substantial preparation before an engineer can ask a simple operational question.

Grayson TimeSeries helps the people closest to the problem ask direct questions of one prepared CSV or Excel file and receive evidence-based answers backed by deterministic, reproducible analysis.

CNC Spindle-Load Variation at Comparable Cutting Conditions

The cost: Spindle load can vary with tool condition, program, material, feed, speed, depth of cut, gear range, warm-up state, workholding, and measurement configuration. Reviewing raw controller traces without that context can make normal variation look like a mechanical problem.

What Grayson does: Analyzes prepared cycle or operation summaries containing spindle-load statistics, commanded speed and feed, program and operation ID, tool ID, material or part family, gear range, cycle time, machine state, and documented tool-change or maintenance markers. Trend, anomaly, correlation, and period comparison can show where the historical relationship changed.

Ask Grayson: “Compare spindle-load mean, peak, and variation for Tool 12 during the same program and material family before and after the documented tool change. Which cycles remain unusual after controlling for speed and feed?”

Outcome: Help the manufacturing or tooling engineer identify unusual cycles and contextual factors for qualified review. Grayson does not parse raw waveforms, diagnose tool wear, or change feeds and speeds.
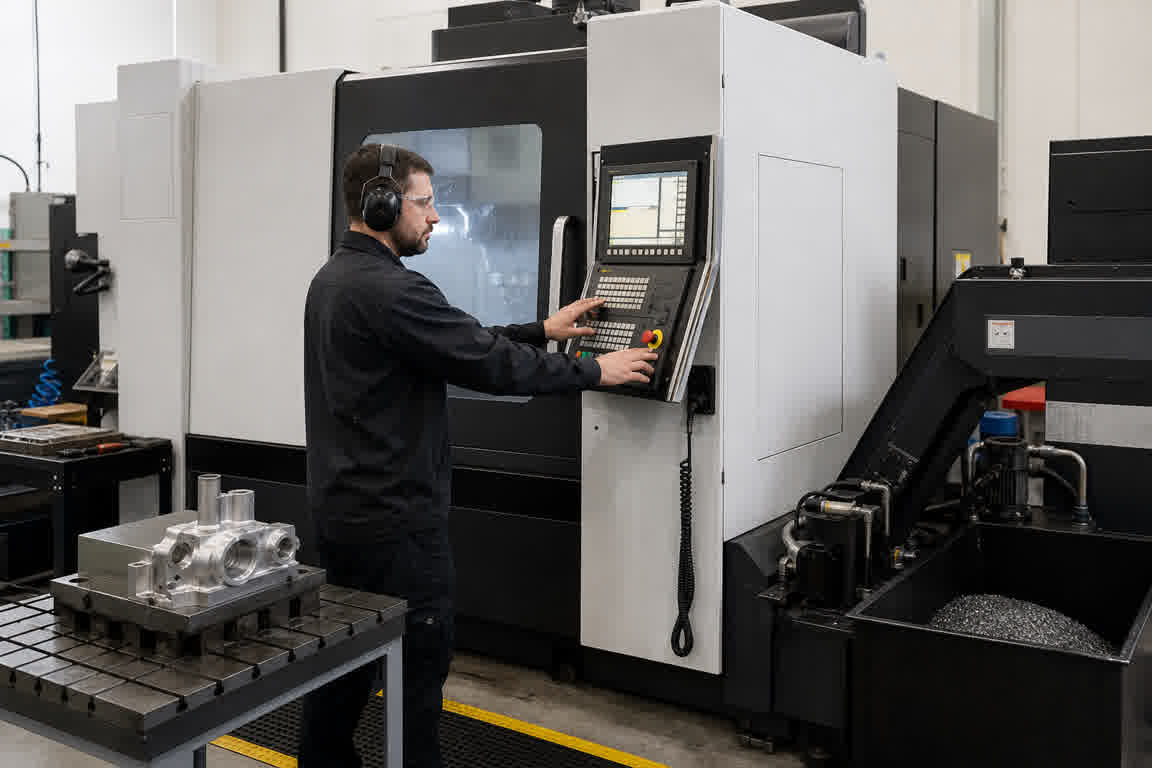
Guarded CNC machining center with chip conveyor and coolant system

Prepared Resistance Spot-Weld Signature Comparison

The cost: Resistance spot-welding data can be sampled at kilohertz rates, producing far more raw waveform data than a short file-based investigation can use. Weld schedule, sheet stack, coating, fit-up, electrode condition, shunting, force, current, voltage, and controller processing can all affect the recorded signature.

What Grayson does: Analyzes one row per weld or prepared event-window summaries containing weld schedule, station, electrode count, current and voltage features, controller-derived or pre-calculated dynamic-resistance features, force feedback where physically measured, controller event codes, and inspection or test context where available. Grayson can compare distributions, identify anomalies, and show when the prepared signature changed.

Ask Grayson: “Compare the prepared dynamic-resistance and current-summary features for this weld schedule across the early, middle, and late electrode-use periods. Which stations or event windows differ most from the baseline?”

Outcome: Give welding and quality engineers a focused list of stations, schedules, electrodes, and weld events for qualified review. The analysis does not infer nugget size, certify weld quality, or release parts.

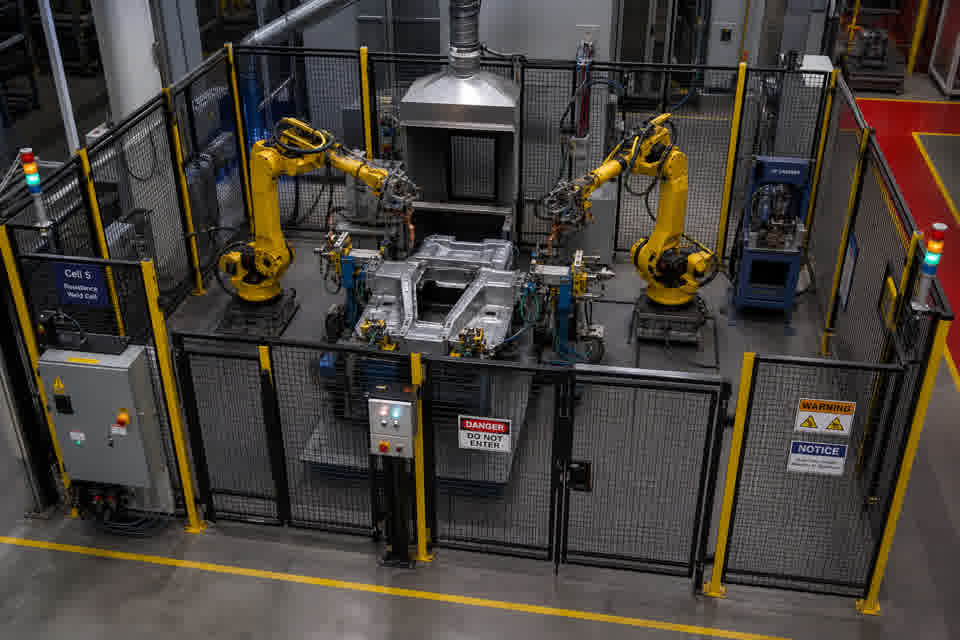
Guarded robotic resistance spot-welding cell with servo weld guns

Compressed-Air Header Pressure and Load/Unload Patterns

The cost: A compressed-air system can show more frequent load transitions, longer unloaded operation, or faster receiver-pressure decay for many reasons, including production demand, sequencer logic, maintenance state, storage, pressure settings, instrumentation, or leakage. A trend alone does not identify which explanation is correct.

What Grayson does: Analyzes prepared utility data containing receiver or header pressure, package power, compressor state, delivered flow where measured, production state, shift, sequencer mode, maintenance markers, and prepared cycle-duration or duty-fraction fields. Trend, anomaly, correlation, and operating-period comparison can show when the historical pattern changed.

Ask Grayson: “Compare receiver-pressure decay, loaded duration, unloaded duration, and package power across comparable production shifts before and after the documented maintenance period. Which pattern changed first?”

Outcome: Help the reliability or energy team prioritize the next utility investigation. Grayson does not prove leakage, set compressor pressure, or control equipment.

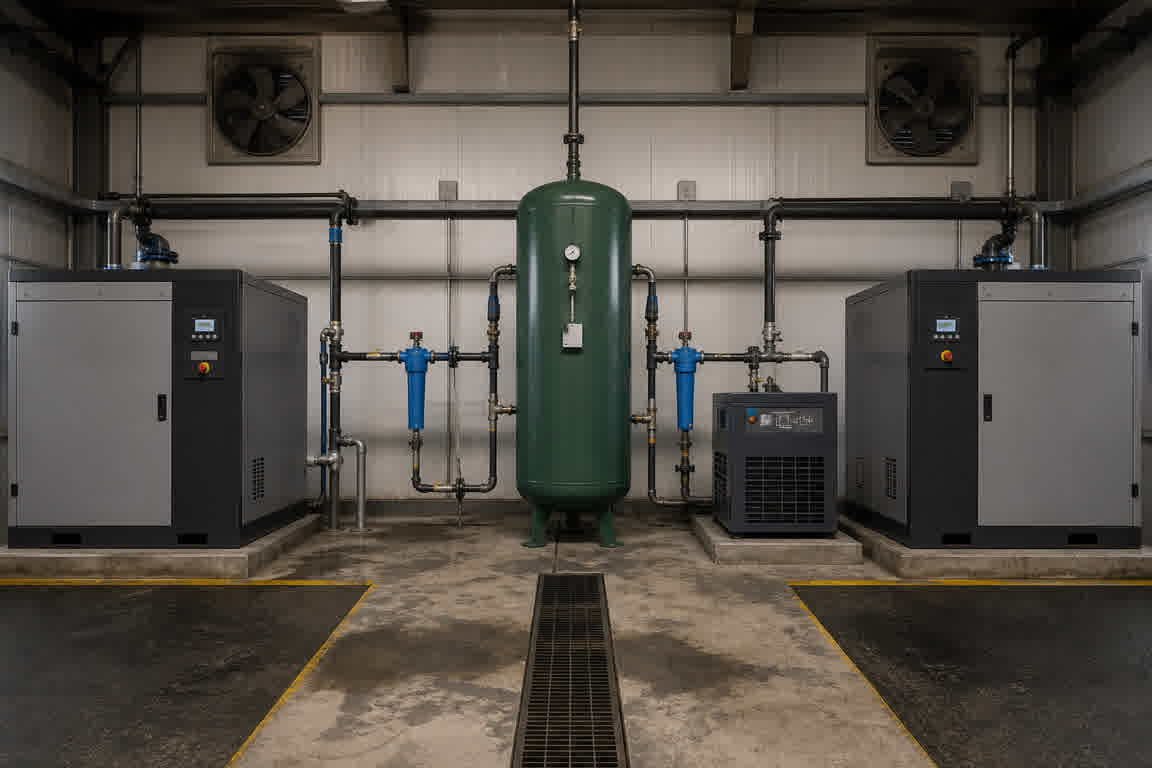
Industrial compressed-air room with rotary-screw compressors and receiver tank

Grayson TimeSeries

Grayson TimeSeries is a Microsoft Teams app that lets engineers and operators individually chat with their industrial process data for quick insights with a deterministic and auditable AI agent.

MICROSOFT COPILOT

Powered by Microsoft Copilot and available in Teams, making it easy to use within your Microsoft 365 ecosystem.

PROCESS DATA ANALYTICS

Grayson TimeSeries prepares and validates your process data automatically, detects anomalies, makes forecasts and establishes correlations.

FAQ

Answers to help you get started faster.

Real stories from teams who streamlined their workflow and delivered more with less.

What is Grayson TimeSeries?

Grayson TimeSeries is a no-code industrial time-series analytics application for Microsoft Teams. Upload one prepared CSV or Excel file, ask in plain language, and get reproducible charts and reports. It does not replace plant control or specialized engineering tools.

How is Grayson different from CNC controls, PLCs, MES, OEE, historians, and machine-monitoring systems?

Grayson complements those systems with conversational analysis of prepared historical exports inside Microsoft Teams. It does not replace real-time control, machine protection, or specialized monitoring.

Can Grayson combine controller, MES, quality, meter, and maintenance data?

Yes, when those fields are already aligned in one suitable CSV or Excel file. Separate exports must be combined and time-aligned before upload.

How should high-frequency CNC, weld, servo, torque, or waveform data be prepared?

Reduce raw high-frequency records into cycle summaries, event windows, or prepared statistical features before upload. Grayson does not automatically parse waveforms or create tool, weld, or machine-state labels.

Can Grayson determine tool condition, weld quality, part quality, or equipment condition?

No. Grayson surfaces historical patterns and anomalies in prepared data. Condition, acceptance, and disposition remain qualified inspection and engineering judgment.

Can Grayson recommend new machine settings or control production equipment?

No. Grayson is read-only historical analysis. It does not change CNC settings, weld schedules, PLC logic, or compressor setpoints.