Consumer Packaged Goods Manufacturing

Self-Service Industrial Time Series Analytics for Consumer Packaged Goods Manufacturing

Find the patterns behind fill-weight variation, unstable web tension, slow post-changeover ramp-up, and recurring packaging micro-stops before they become another manual spreadsheet investigation. Grayson TimeSeries helps non-food CPG production, quality, converting, packaging, and reliability teams analyze prepared historical data inside Microsoft Teams using deterministic and auditable methods.

Get answers, quickly, by chatting with your industrial process data inside Microsoft Teams.

Self-service industrial time series analytics

Ask Your Data. Get Answers Now. In Teams.

Get fast, trustworthy answers from prepared historical filling, converting, packaging, checkweigher, PLC, OEE, quality-context, and maintenance data through conversation, with no new dashboard, no coding, and no waiting for someone else.

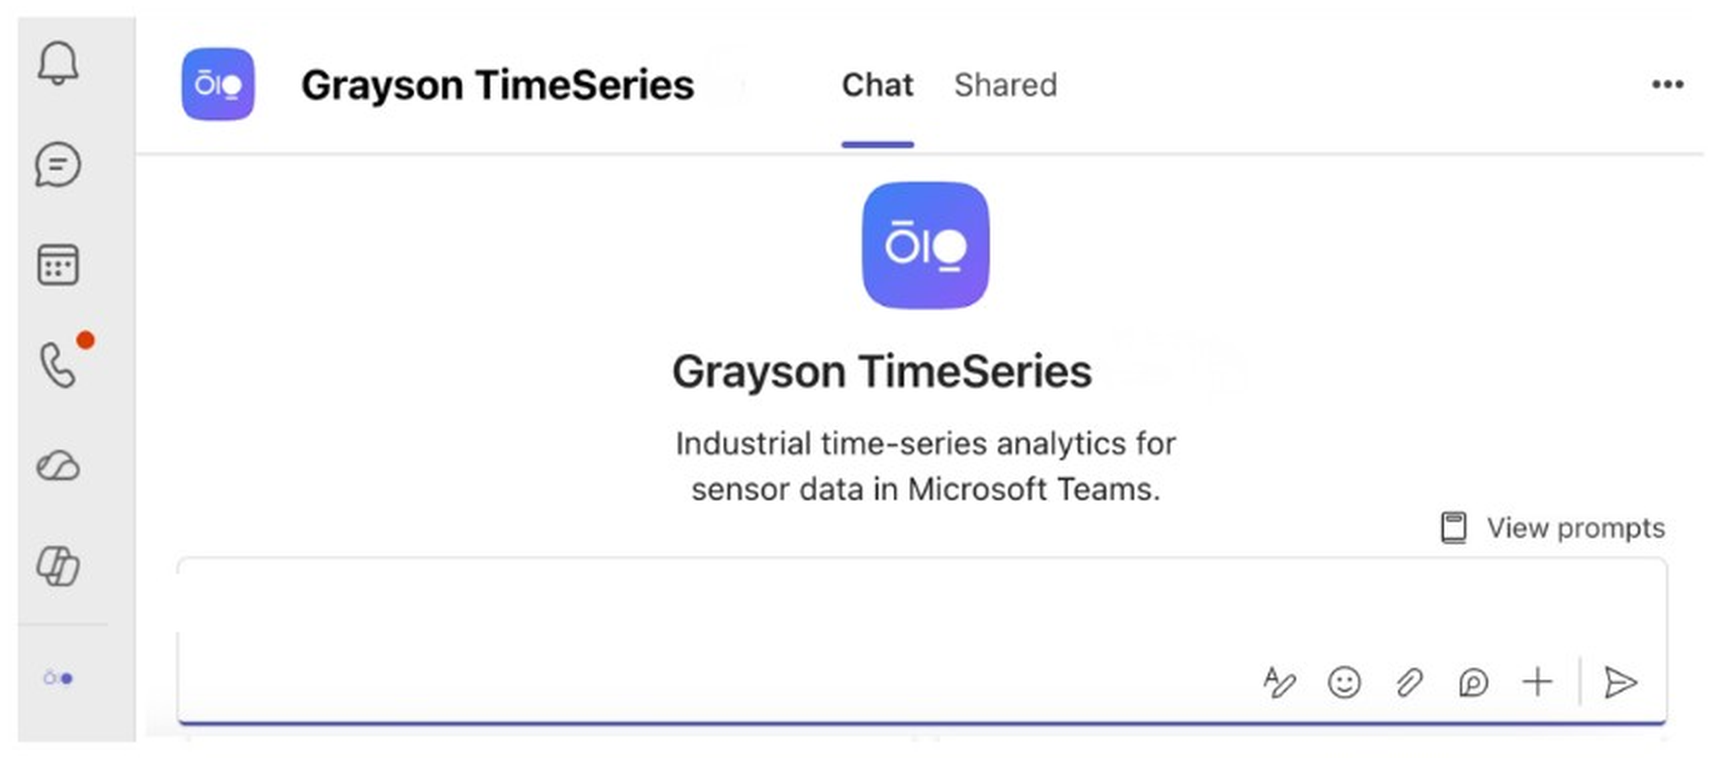
Grayson TimeSeries welcome screen in Microsoft Teams
Use Cases

The answers are already in your CPG manufacturing data

Non-food CPG plants generate checkweigher summaries, filler-head context, converting-line trends, dancer and tension measurements, PackML or OEE states, micro-stop events, SKU and package-format labels, maintenance records, and inspection results. The evidence behind a recurring variance or slow recovery can be difficult to see until the data is aligned and compared across equivalent runs.

Grayson TimeSeries helps the people closest to the problem ask direct questions of one prepared CSV or Excel file and receive evidence-based answers backed by deterministic, reproducible analysis.

Fill-Weight Variation and Prepared Material Giveaway

The cost: Small mass differences can accumulate across high-volume personal-care and home-care filling lines, but container tare, product density, temperature, line speed, target mass, filler-head identity, checkweigher performance, and batch context all affect the interpretation.

What Grayson does: Analyzes prepared checkweigher or filler summary data containing net mass, target mass, filler-head ID, batch, SKU, package format, product temperature, line speed, prepared window statistics, and a documented giveaway metric when available. Descriptive statistics, anomaly detection, correlation, and period comparison can identify persistent head-to-head or batch-to-batch differences.

Ask Grayson: “Compare mean net mass and variation across filler heads for the same SKU, package format, and stable line speed. Which heads contribute most to the prepared material-giveaway total?”

Outcome: Help production and quality teams prioritize checkweigher calibration, static weight checks, filler-head inspection, product-density review, tare review, and batch-context checks.
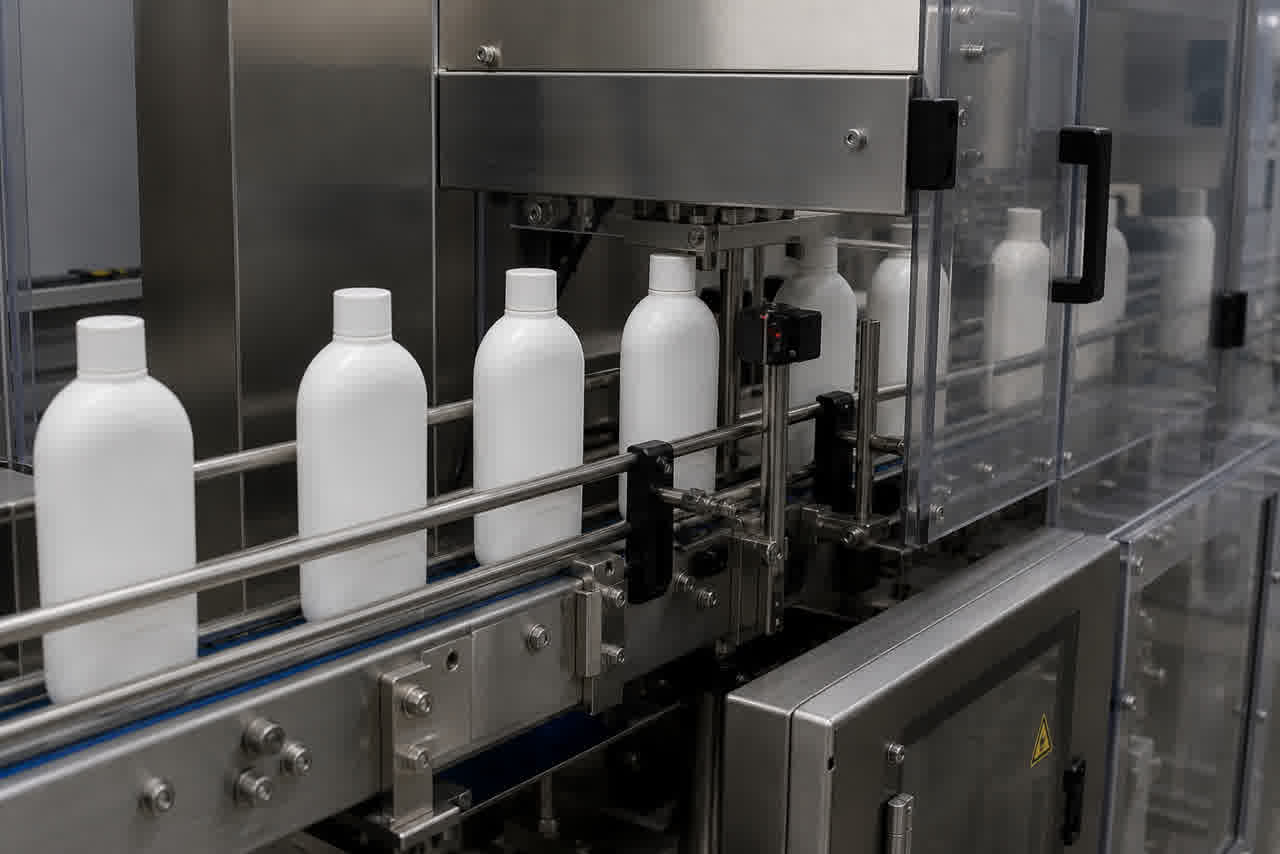
Inline checkweigher downstream of an enclosed personal-care liquid filler

Tissue-Converting Web-Tension Instability During Speed Transitions

The cost: Tension spikes and dancer saturation can contribute to web instability, but parent-roll diameter, basis weight, ply, moisture, roll quality, brake or drive torque, web path, control tuning, splice condition, and machine speed can all change the response.

What Grayson does: Analyzes prepared one-second or event-window data containing unwind tension, dancer position, line speed, prepared acceleration rate, parent-roll diameter, torque or brake output, machine state, roll ID, product context, and web-break markers where available. Anomaly, correlation, lead-lag, and period comparison can show which recorded conditions differ during speed transitions.

Ask Grayson: “Compare web-tension variation and dancer travel during similar ramp-up events for the same product and parent-roll range. Which transitions show the largest departure from the stable baseline?”

Outcome: Compare stable and unstable speed transitions to find the ramps, roll conditions, dancer travel, and tension patterns that deserve review. Converting and reliability teams can use that event list to focus checks on the web path, brakes or drives, sensors, splices, and parent-roll context.

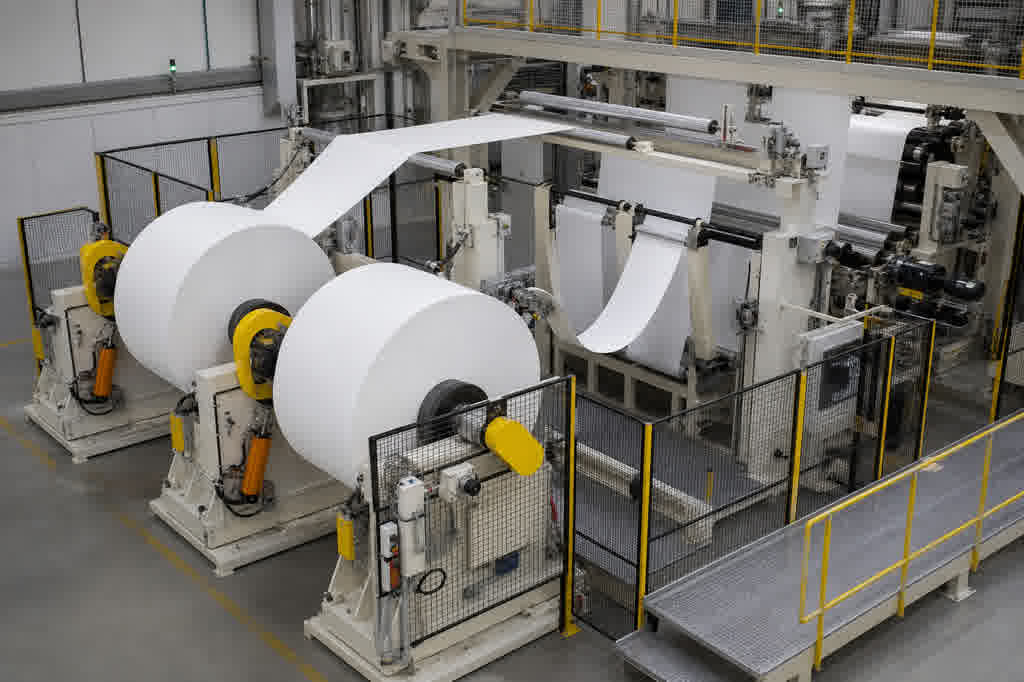
Tissue converting unwind section with parent-roll stands and dancer festoon

Post-Changeover Line-Speed Ramp and Micro-Stop Comparison

The cost: A line may produce a first good unit quickly but still take much longer to reach stable speed. Without consistent changeover boundaries, SKU and package context, machine states, and reason-coded events, teams can argue about the duration instead of comparing equivalent ramps.

What Grayson does: Compares prepared changeover windows containing changeover start, completion, first-good-unit and stable-production markers, target and actual line speed, machine state, SKU, package format, micro-stop event duration and reason category, shift, crew or line context, and documented maintenance or adjustment markers. Period comparison and event-frequency analysis can show which ramps and categories differ most.

Ask Grayson: “Compare time to stable production and micro-stop frequency across these changeovers for the same package family. Which reason categories recur most often before the line reaches its target speed?”

Outcome: Show which changeovers take longest to reach stable speed, which micro-stop categories dominate the ramp, and which setup conditions recur across slow recoveries. Packaging and continuous-improvement teams can turn that evidence into targeted work on setup standards, material staging, guides, sensors, and reason-code quality.

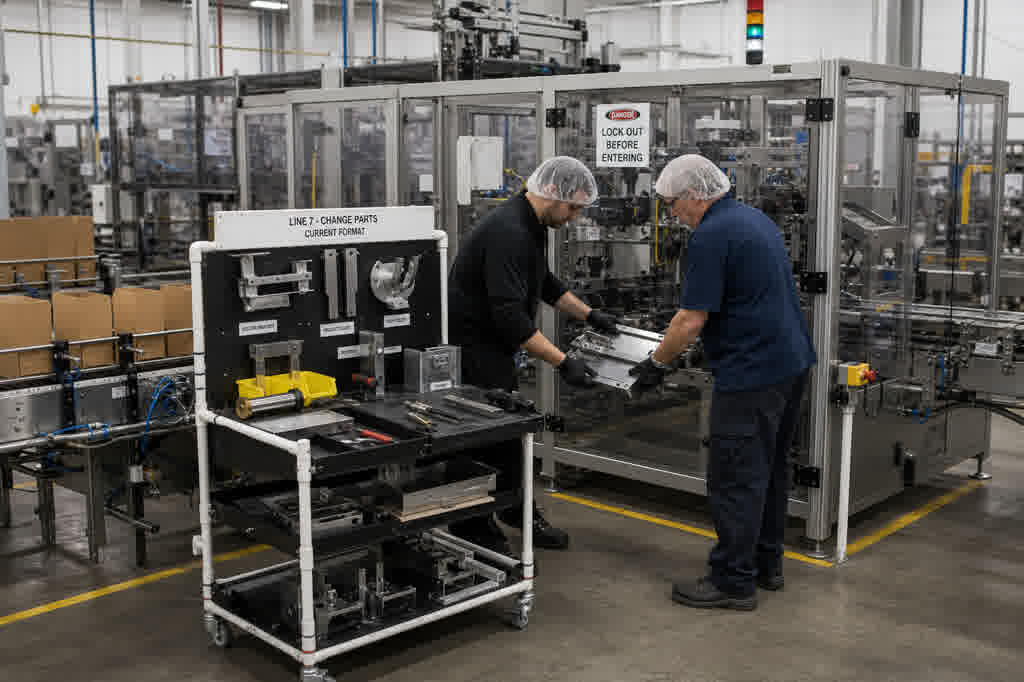
Guarded secondary packaging line with cartoner and staged change parts

Grayson TimeSeries

Grayson TimeSeries is a Microsoft Teams app that lets engineers and operators individually chat with their industrial process data for quick insights with a deterministic and auditable AI agent.

MICROSOFT COPILOT

Powered by Microsoft Copilot and available in Teams, making it easy to use within your Microsoft 365 ecosystem.

PROCESS DATA ANALYTICS

Grayson TimeSeries prepares and validates your process data automatically, detects anomalies, makes forecasts and establishes correlations.

FAQ

Answers to help you get started faster.

Real stories from teams who streamlined their workflow and delivered more with less.

What is Grayson TimeSeries?

Grayson TimeSeries is a no-code industrial time-series analytics application for Microsoft Teams. Users upload one prepared CSV or Excel file, ask questions in plain language, investigate anomalies, correlations, lead-lag relationships, trends, forecasts, and operating periods, and create reproducible charts and reports.

How is Grayson different from packaging controllers, MES, OEE, historians, and quality systems?

Those systems remain essential for control, state tracking, production execution, storage, dashboards, inspection, and quality records. Grayson complements them by giving individual users a conversational way to investigate prepared historical exports inside Microsoft Teams. It does not replace real-time control or validated quality workflows.

Can Grayson combine batch, PLC, checkweigher, OEE, quality, and maintenance data?

Grayson can analyze the required fields when they are already aligned and supplied in one suitable CSV or Excel file. Separate exports must be combined, timestamps synchronized, IDs mapped, and batch, recipe, SKU, package, machine-state, changeover, event, and maintenance labels prepared before upload.

How should high-speed checkweigher, filling, converting, and packaging data be prepared?

Use an appropriate unit sample, filler-head summary, cycle-level summary, event-aligned table, time-window aggregation, micro-stop event table, or selected production window. Grayson does not automatically aggregate unit records, segment cycles, extract web or valve features, decode alarm words, or create reason-code classifications.

Can Grayson analyze prepared material giveaway across filler heads and batches?

Yes. When target mass, net mass, filler-head ID, SKU, package format, and a prepared giveaway field are included as applicable, Grayson can compare mass distributions and identify which heads or batches contribute most to the giveaway total. Density or tare conversion and legal net-content decisions stay with plant procedures and checkweigher workflows.

Can Grayson compare web-tension events and changeover recovery patterns?

Yes. On prepared speed-transition and changeover windows, Grayson can compare tension, dancer travel, time to stable speed, and micro-stop reason categories against a stable baseline. That event list helps converting, packaging, and continuous-improvement teams focus checks on the web path, brakes or drives, sensors, splices, setup standards, staging, and reason-code quality.