Buildings & Facilities

Self-Service Time-Series Analytics for Building & Facility Operations

Find the patterns in your BAS, BMS, HVAC, meter, and schedule data before they become higher energy use, recurring operating problems, or another unanswered investigation. Grayson TimeSeries lets building operators, facility engineers, and energy managers chat with prepared historical building data inside Microsoft Teams for quick insights backed by deterministic and auditable analysis.

Get answers, quickly, by chatting with your industrial process data inside Microsoft Teams.

Self-service industrial time series analytics

Ask Your Data. Get Answers Now. In Teams.

Get fast, trustworthy answers from prepared historical building data through conversation, with no new dashboard, no coding, and no waiting for someone else to run the analysis.

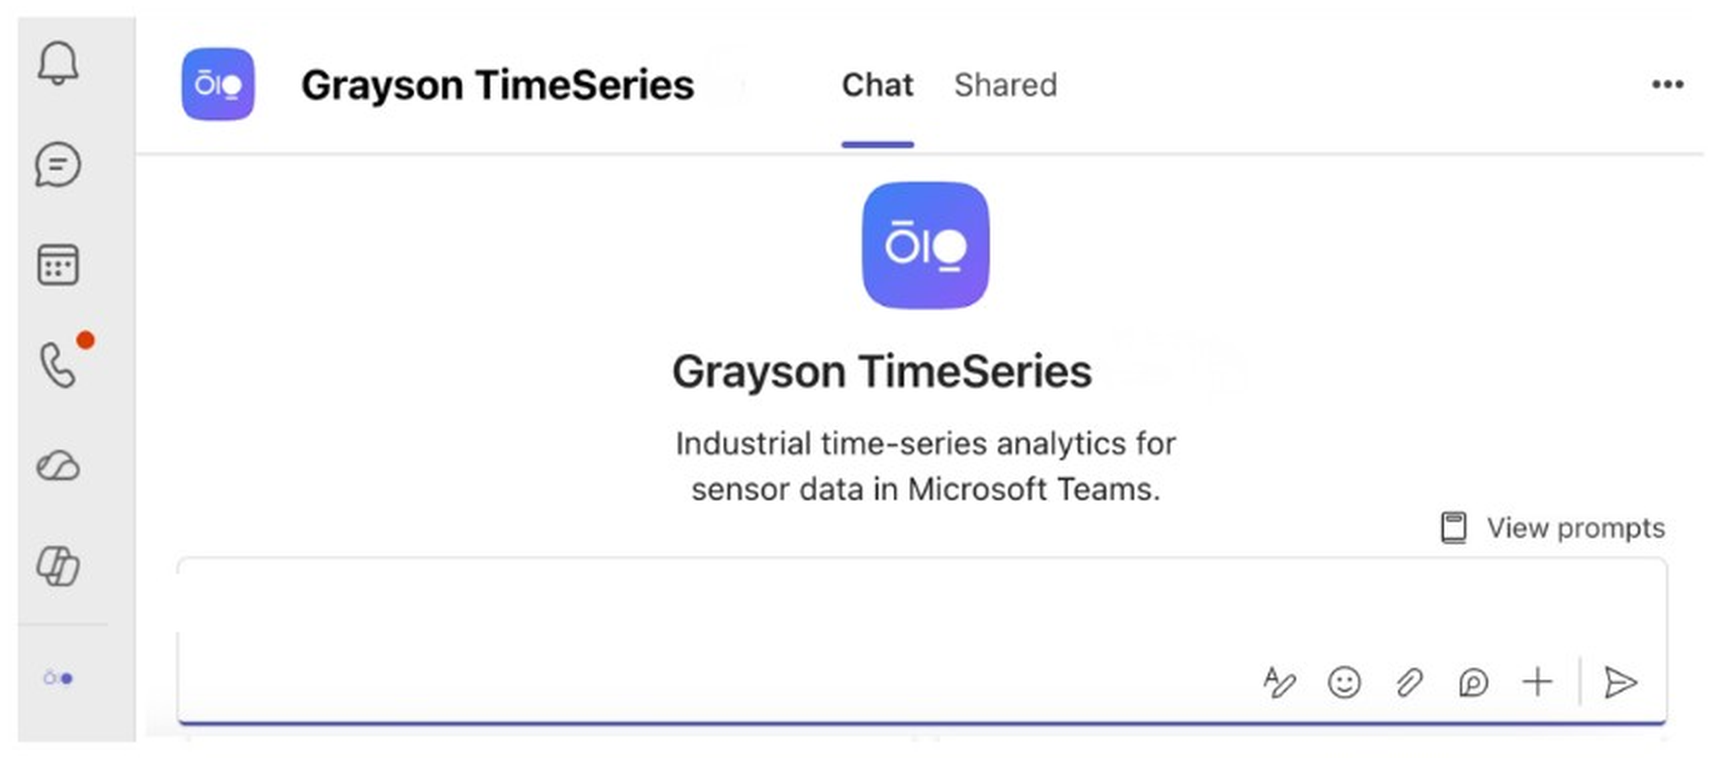
Grayson TimeSeries welcome screen in Microsoft Teams
Use Cases

The answers are already in your building trend data

Facility teams are surrounded by BAS and BMS trend logs, meter exports, control signals, equipment data, weather records, and schedule information. The people closest to the problem often do not have time to manually compare every chiller, air-handling unit, zone, and operating period. Useful evidence gets buried in spreadsheets, dashboards, screenshots, alarms, and work-order notes.

Grayson TimeSeries helps building operators, facility engineers, energy managers, and commissioning teams ask direct questions of one prepared CSV or Excel file and receive evidence-based answers backed by deterministic analysis.

Chiller Performance at Comparable Operating Conditions

The cost: A chiller can continue holding its leaving-water setpoint while using more electrical power per unit of cooling. Without comparing equivalent operating conditions, a real performance shift can be mistaken for hotter weather, different load, or normal plant variation.

What Grayson does: Compares prepared chiller efficiency, power, cooling load, entering condenser-water temperature, operating state, and baseline, current, and post-maintenance periods. Grayson can identify whether the shift was gradual or sudden, show whether it persists under comparable conditions, and determine whether performance returned toward baseline after a documented intervention.

Ask Grayson: “Compare Chiller 1 efficiency across the baseline, degraded, and post-maintenance periods under comparable cooling loads and entering condenser-water temperatures. When did the shift begin, and did performance return toward baseline after maintenance?”

Outcome: Help the facility engineer confirm the performance change is supported by historical data and prioritize a qualified inspection. The analysis does not diagnose tube fouling on its own.
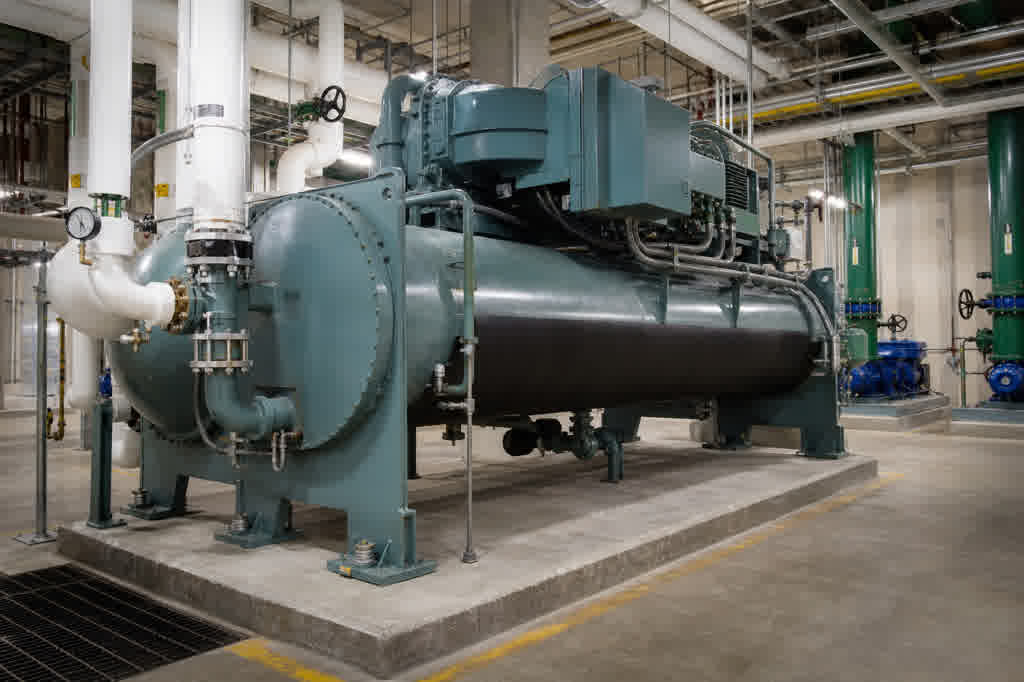
Water-cooled centrifugal chiller in a commercial central plant

Unexpected AHU Mixed-Air Behaviour

The cost: Unexpected mixed-air behavior can increase heating or cooling-coil load, complicate comfort investigations, and send technicians toward the wrong component when a command signal is mistaken for physical damper position or airflow.

What Grayson does: Compares outdoor-air, return-air, mixed-air, and supply-air temperatures with damper command, fan status, operating mode, and documented inspection or adjustment periods. Correlation, anomaly detection, and lead-lag analysis can show when mixed-air response changed and which signals moved first.

Ask Grayson: “During mechanical-cooling periods when the outdoor-air damper command was at its minimum position, when did mixed-air temperature begin tracking outdoor-air temperature more closely than the baseline?”

Outcome: Help the controls specialist identify the strongest periods for inspection and distinguish a persistent pattern from isolated noise. Physical cause still requires qualified field review.

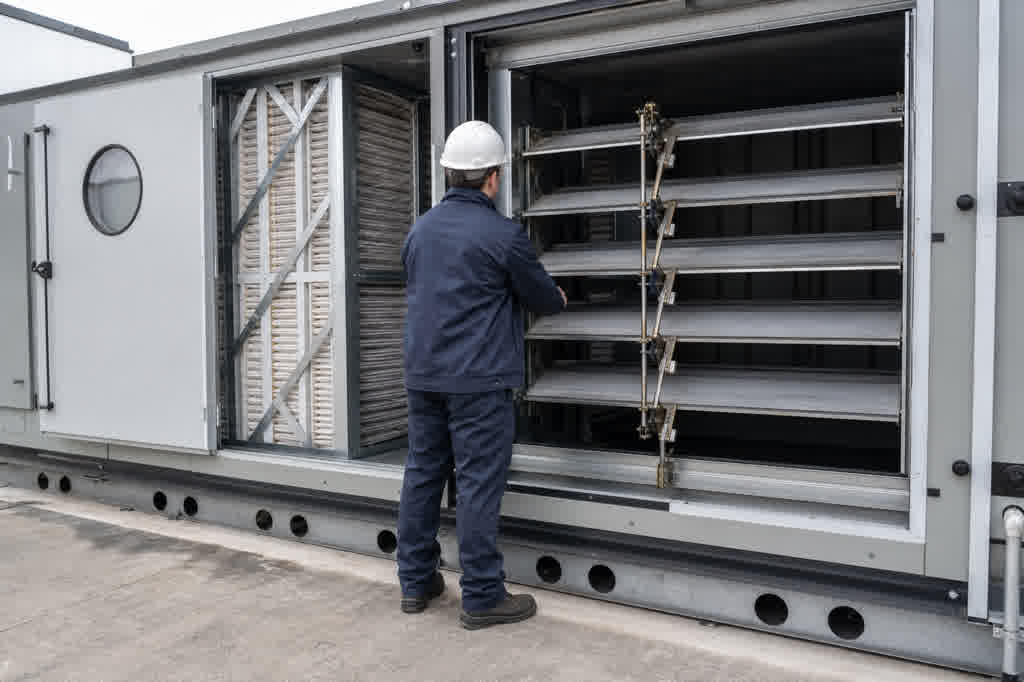
Commercial air-handling unit mixing section with outdoor-air and return-air dampers

Increased After-Hours Building Electrical Demand

The cost: A higher after-hours load can persist for weeks before it stands out in a utility review. Whole-building meter data reveals the change, but legitimate 24-hour loads, cleaning, events, refrigeration, server rooms, seasonal HVAC, and changed building use must be considered before calling it waste.

What Grayson does: Compares occupied and unoccupied periods, day types, schedule windows, and before-and-after operating periods. When equipment-level power, submeter data, enable signals, or schedule markers are included, Grayson can show which changes coincide with the increase and when the new pattern began.

Ask Grayson: “Compare whole-building electrical demand during prepared unoccupied periods before and after the increase. When did the change begin, and which available equipment or schedule signals changed at the same time?”

Outcome: Help the energy manager mark when demand changed, quantify the measured shift, and prioritize the next BAS, meter, or schedule investigation. Whole-building demand alone does not identify the responsible circuit.

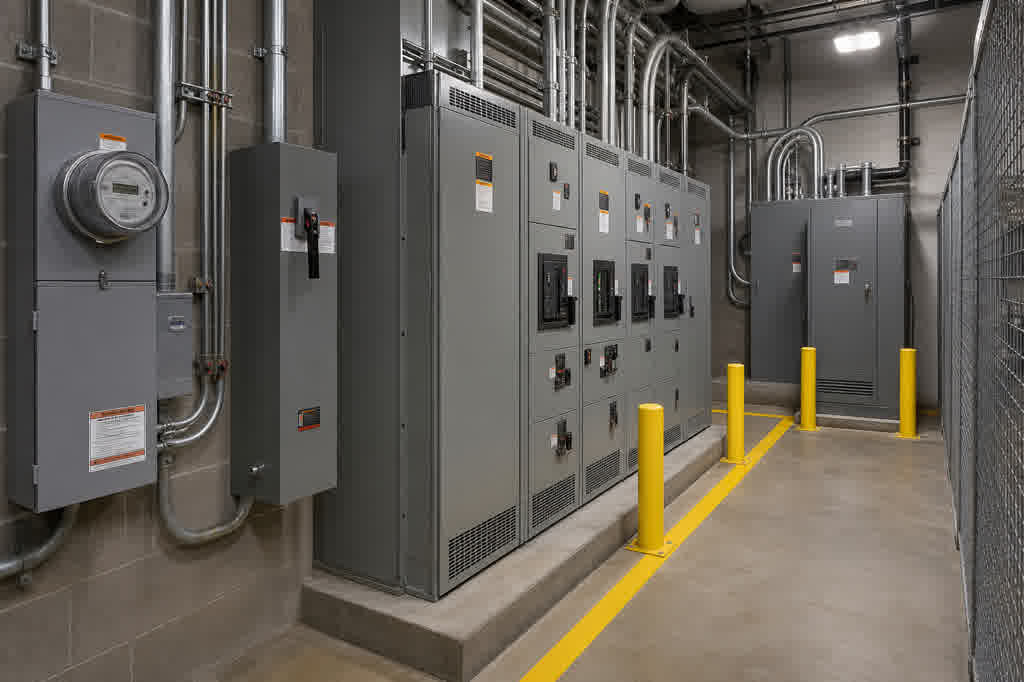
Commercial building electrical room with interval meter and switchgear

Grayson TimeSeries

Grayson TimeSeries is a Microsoft Teams app that lets engineers and operators individually chat with their industrial process data for quick insights with a deterministic and auditable AI agent.

MICROSOFT COPILOT

Powered by Microsoft Copilot and available in Teams, making it easy to use within your Microsoft 365 ecosystem.

PROCESS DATA ANALYTICS

Grayson TimeSeries prepares and validates your process data automatically, detects anomalies, makes forecasts and establishes correlations.

FAQ

Answers to help you get started faster.

Real stories from teams who streamlined their workflow and delivered more with less.

What is Grayson TimeSeries?

Grayson TimeSeries is a Microsoft Teams app for no-code analysis of prepared historical time-series data. Building and facility teams can upload a CSV or Excel file, ask questions in plain language, review deterministic analysis, and export or share findings without creating another dashboard.

How is Grayson TimeSeries different from BAS dashboards and automated fault-detection platforms?

BAS and BMS dashboards are built for monitoring and control, while automated fault-detection platforms continuously apply configured rules or models. Grayson is a complementary, self-service analysis layer for ad hoc questions using prepared historical data. It helps a user investigate patterns, compare operating periods, and document evidence without claiming an automatic physical diagnosis or issuing control commands.

Can Grayson analyze data from my existing BAS, BMS, EMS, meter, or historian?

Yes, when the relevant data can be exported and prepared as a suitable CSV or Excel file. Grayson does not require a direct connection for file-based analysis. If data comes from several systems, align the timestamps, combine the required fields, and provide one prepared file before upload. Availability varies by building, system, sensor, and metering configuration.

How should I prepare change-of-value BAS trends or data with mismatched timestamps?

Convert change-of-value logs to a consistent time basis when the analysis requires direct comparison, document the resampling method, and align timestamps from separate sources before upload. Preserve missing values rather than silently inventing measurements. Grayson's data-quality analysis can help surface gaps, outliers, and flatlined signals, but the file should already be combined and time-aligned.

Which calculated variables should I include before upload?

Include any engineering variable required by the question, such as cooling load, chiller efficiency in kW per ton or COP, temperature differential, occupied or unoccupied flags, comparable-condition flags, outdoor-air fraction estimates, runtime totals, or maintenance-period labels. Document each calculation and its assumptions. Do not assume Grayson will create these variables automatically.

Can Grayson compare command, status, and physical feedback for dampers, valves, fans, or pumps?

Yes. When command, status, and physical feedback such as measured flow, position feedback, or equipment-level power are in the prepared file, Grayson can compare how those signals move together over time. A command or status point alone does not prove physical position or flow; use the comparison to support a qualified inspection.