Water & Wastewater

Self-Service Industrial Time Series Analytics for Water and Wastewater Operations

Find the patterns behind filter turbidity spikes, clarifier upsets, wet-weather flows, pump runtime, and treatment-process variability before they turn into extended troubleshooting, lost capacity, or another unanswered shift handoff. Grayson TimeSeries lets treatment operators and engineers individually chat with historical operational data for quick insights with a deterministic and auditable AI agent.

Get answers, quickly, by chatting with your industrial process data inside Microsoft Teams.

Self-service industrial time series analytics

Ask Your Data. Get Answers Now. In Teams.

Get fast, trustworthy answers from your treatment and utility process data through conversation - no new dashboards, no coding, and no waiting for someone else.

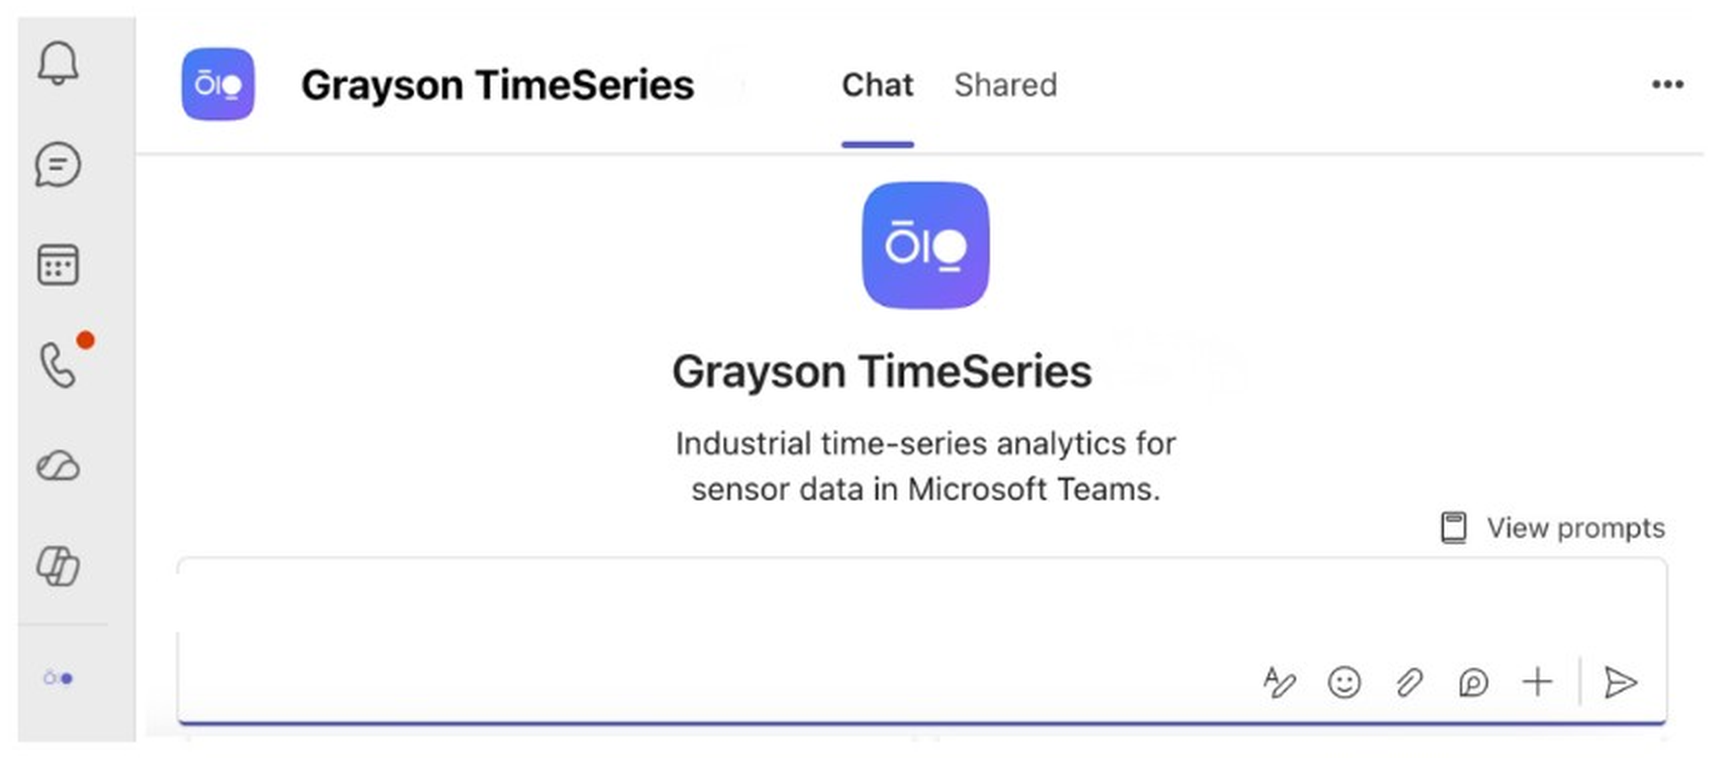
Grayson TimeSeries welcome screen in Microsoft Teams
Use Cases

The answers are already in your water and wastewater data

Water and wastewater teams are surrounded by SCADA trends, historian exports, online analyzer data, equipment states, laboratory results, and weather records. The patterns behind a slow filter recovery, a rising clarifier blanket, or pumps running long after a storm can be buried across spreadsheets, dashboards, alarms, and shift notes.

Grayson TimeSeries Lite helps treatment operators and engineers ask direct questions of prepared historical data and get evidence-based answers backed by deterministic models.

Post-Backwash Filter Ripening and Turbidity Spikes

The cost: When a granular media filter takes longer than expected to settle after backwash, the plant may extend filter-to-waste, lose treated-water capacity, and spend valuable operator time comparing cycles manually.

What Grayson does: Compares effluent turbidity, filter flow, and backwash operating states across multiple filters and cycles to surface unusual peaks, extended recovery patterns, and changes from the filter's recent baseline.

Ask Grayson: “Compare post-backwash effluent turbidity for Filters 1, 2, and 3 over the last 30 days. Which cycles show unusually high peaks or a noticeably slower return toward baseline?”

Outcome: Help the operator verify whether one filter is behaving differently from its peers and identify the cycles and signals that warrant closer process or maintenance review.
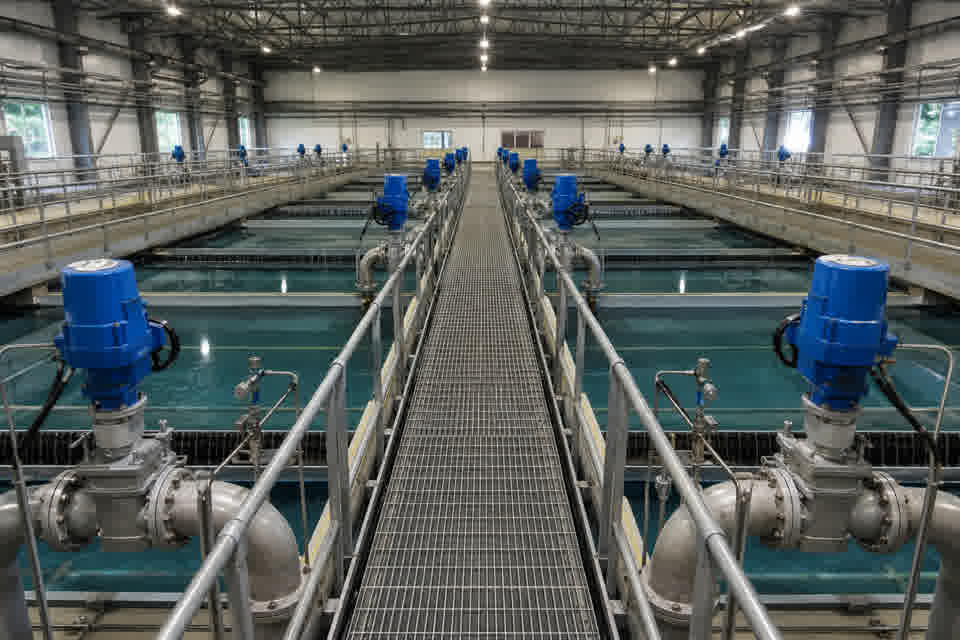
Municipal drinking-water filter gallery with parallel granular media filter bays

Wet-Weather Clarifier Response and Solids Carryover

The cost: A rapid increase in influent flow can coincide with a rising sludge blanket and deteriorating effluent quality, reducing treatment stability and leaving operators to reconstruct the event across several trends after the storm has passed.

What Grayson does: Analyzes a prepared historical dataset containing influent flow, sludge blanket depth, RAS pump data, and online effluent TSS or turbidity where available. Cross-correlation and lead/lag analysis help show the sequence and statistical relationships between the hydraulic surge and the clarifier response.

Ask Grayson: “Analyze the April 12 wet-weather event. Did the increase in influent flow precede changes in Clarifier 2 blanket depth and effluent solids, and what lag is visible between the signals?”

Outcome: Give the operations team an evidence-based event timeline for investigating whether hydraulic loading contributed to the upset, without treating correlation as proof of the physical cause.

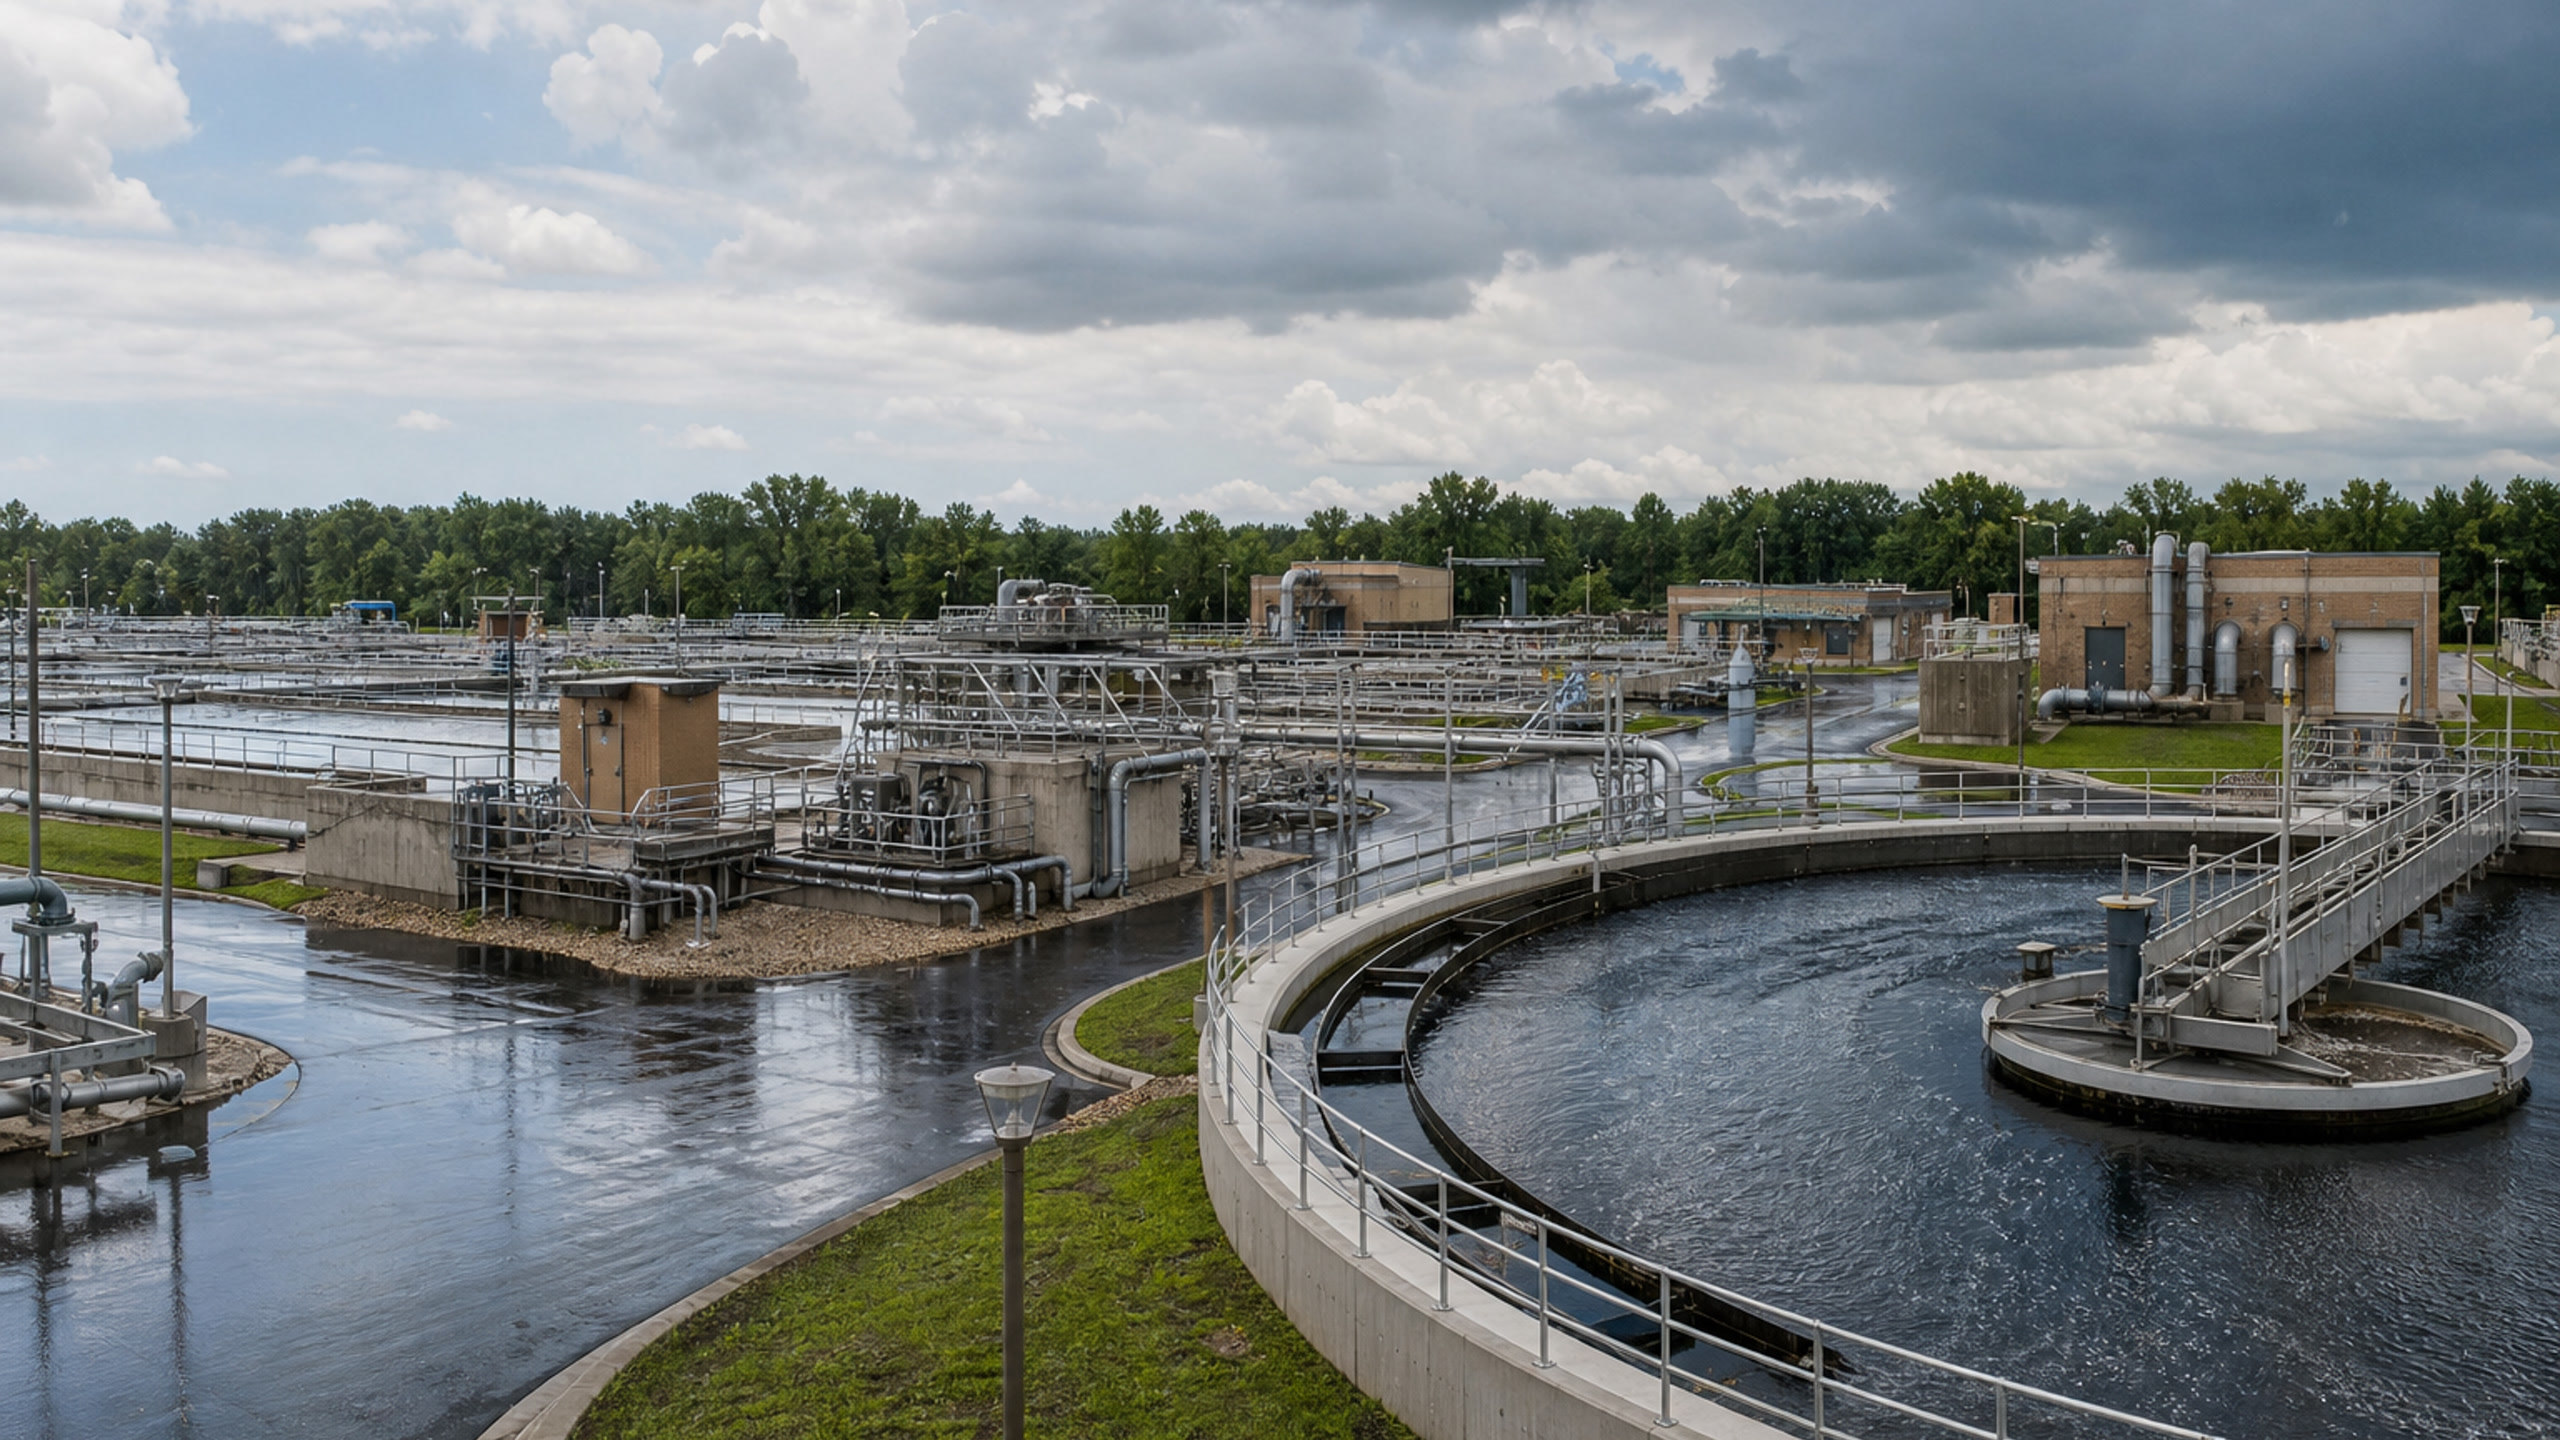
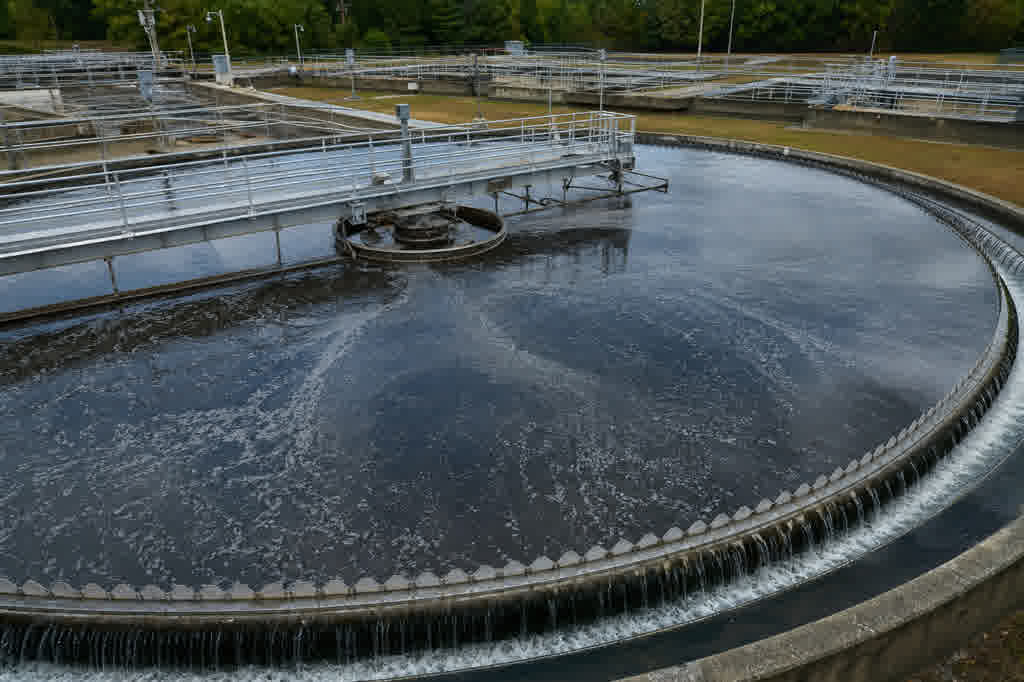
Circular secondary clarifier with rotating bridge and sludge-blanket sensor

Rainfall, Lift-Station Levels, and Pump Runtime

The cost: Wet-weather inflow and infiltration can raise wet-well levels and keep pumps running long after rainfall ends, adding energy use, equipment wear, and capacity pressure across the collection system.

What Grayson does: Analyzes a prepared, combined CSV or Excel file containing rainfall, wet-well level, pump states or runtime, and flow where available. Cross-correlation and lead/lag analysis reveal the historical timing between rainfall and lift-station response, while period comparisons separate wet-weather behavior from a dry-weather baseline.

Ask Grayson: “Using this combined rainfall and lift-station dataset, what lag is visible between peak rainfall, rising wet-well level, and increased pump runtime? Compare the storm period with the dry-weather baseline.”

Outcome: Help collection-system operators quantify when and how strongly a lift station responds after rainfall, supporting further I&I investigation and operational planning without replacing hydraulic modelling or locating the source of infiltration.

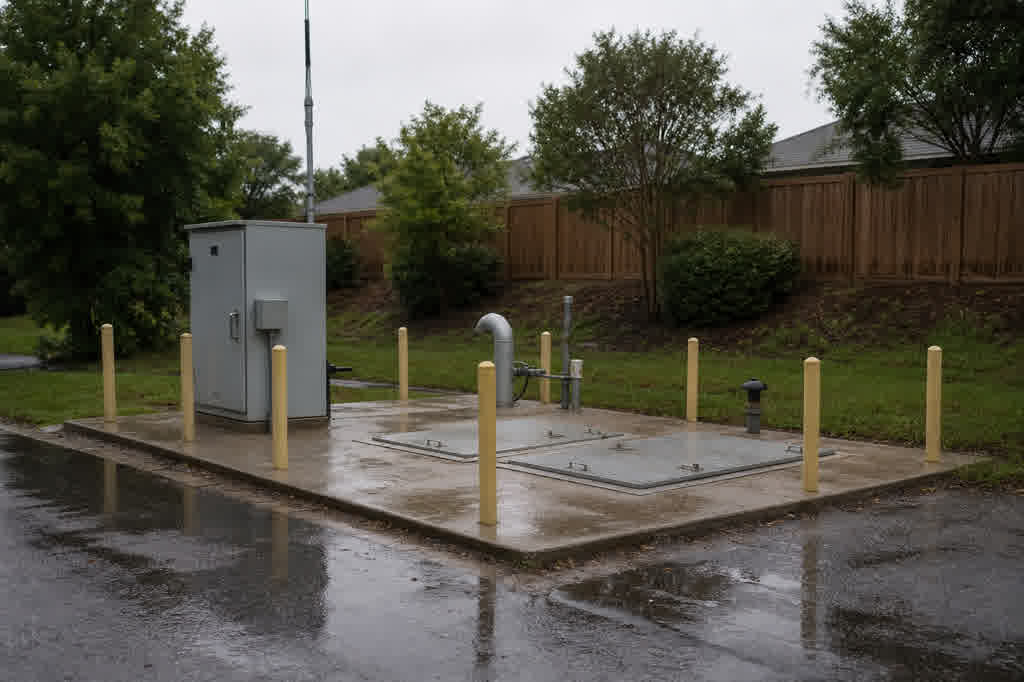
Municipal sanitary-sewer lift station with wet-well hatches and control cabinet

Grayson TimeSeries

Grayson TimeSeries is a Microsoft Teams app that lets engineers and operators individually chat with their industrial process data for quick insights with a deterministic and auditable AI agent.

MICROSOFT COPILOT

Powered by Microsoft Copilot and available in Teams, making it easy to use within your Microsoft 365 ecosystem.

PROCESS DATA ANALYTICS

Grayson TimeSeries prepares and validates your process data automatically, detects anomalies, makes forecasts and establishes correlations.

FAQ

Answers to help you get started faster.

Real stories from teams who streamlined their workflow and delivered more with less.

What is Grayson TimeSeries?

Grayson TimeSeries is an industrial time-series analytics app for Microsoft Teams. Treatment operators and engineers can upload CSV or Excel process data, ask questions in natural language, investigate anomalies, correlations, lead/lag relationships, trends, and forecasts, and create charts and reproducible reports without writing code.

How is Grayson TimeSeries different from traditional water and wastewater SCADA or historian analytics tools?

SCADA systems and historians are essential for monitoring, control, storage, dashboards, and established workflows. Grayson TimeSeries complements those systems by giving individual users a conversational way to investigate prepared historical exports inside Microsoft Teams. It is designed for quick, deterministic, auditable analysis, not to replace your historian, SCADA platform, dashboards, or engineering tools.

Can Grayson analyze data exported from my existing SCADA system or historian?

Yes. If your SCADA system, historian, online analyzer, LIMS, or other operational system can export time-stamped tabular data to CSV or Excel, you can upload that prepared file to Grayson TimeSeries for analysis. A direct connection to the control network is not required for file-based analysis.

Can Grayson analyze both drinking-water and wastewater process data?

Yes. Grayson can analyze historical measurements such as flow, pressure, turbidity, chemical dose, pump runtime, tank or wet-well level, sludge blanket depth, dissolved oxygen, and other time-series variables included in a prepared CSV or Excel file. The available conclusions depend on the measurements and sampling frequency in the dataset.

Can I analyze rainfall and lift-station data together to investigate inflow and infiltration?

Yes, when the rainfall and lift-station measurements are supplied in one prepared CSV or Excel dataset with usable timestamps. Grayson can examine correlations, lead/lag relationships, anomalies, and wet-versus-dry operating periods. It does not replace hydraulic modelling or identify the physical location of an inflow or infiltration source.

Can Grayson determine regulatory compliance or automatically change treatment settings?

No. Grayson supports historical operational investigation and reporting. Compliance decisions, laboratory testing, and treatment setpoints remain with qualified plant workflows.