Data Center Operations

Self-Service Historical Time Series Analytics for Data Center Operations

Investigate rack-inlet thermal excursions, unstable cooling-command patterns, and changes across recurring generator test runs before they become another manual BMS export review. Grayson TimeSeries helps critical-facilities teams analyze prepared historical data inside Microsoft Teams using deterministic and auditable methods.

Get answers, quickly, by chatting with your industrial process data inside Microsoft Teams.

Self-service industrial time series analytics

Ask Your Data. Get Answers Now. In Teams.

Get fast, trustworthy answers from your industrial process data through conversation - no new dashboards, no coding, and no waiting for someone else.

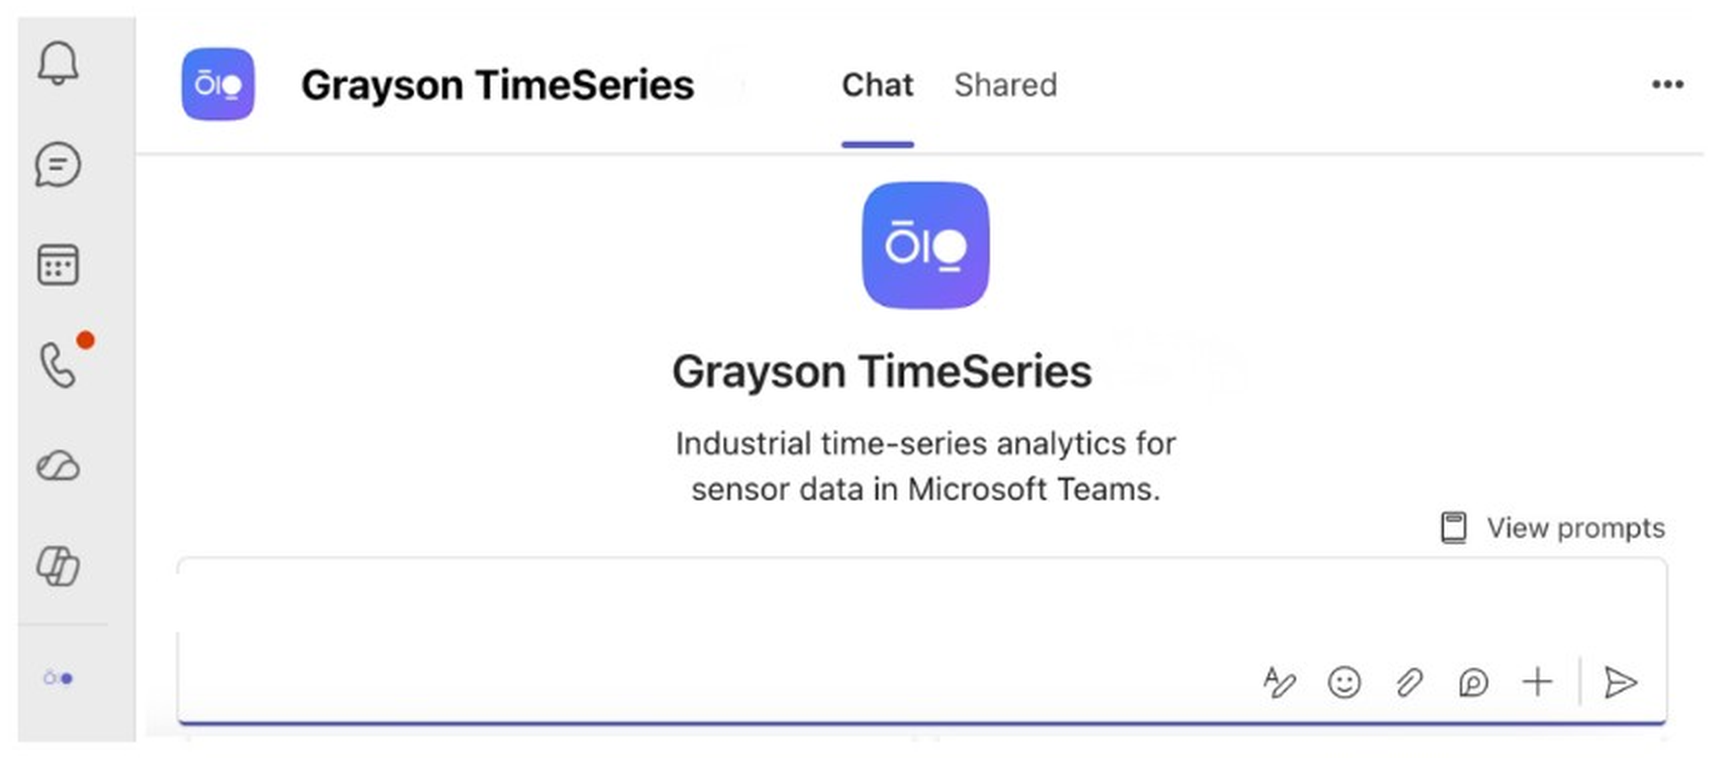
Grayson TimeSeries welcome screen in Microsoft Teams
Use Cases

The answers are already in your historical process data

Data halls generate rack-inlet temperatures, IT-load telemetry, pressure measurements, CRAH commands, supply and return conditions, power meters, generator test records, and maintenance context. The evidence behind a recurring excursion or changing test profile is often split across systems and spreadsheets.

Grayson TimeSeries helps the people closest to the problem ask direct questions of one prepared CSV or Excel file and receive evidence-based answers backed by deterministic, reproducible analysis.

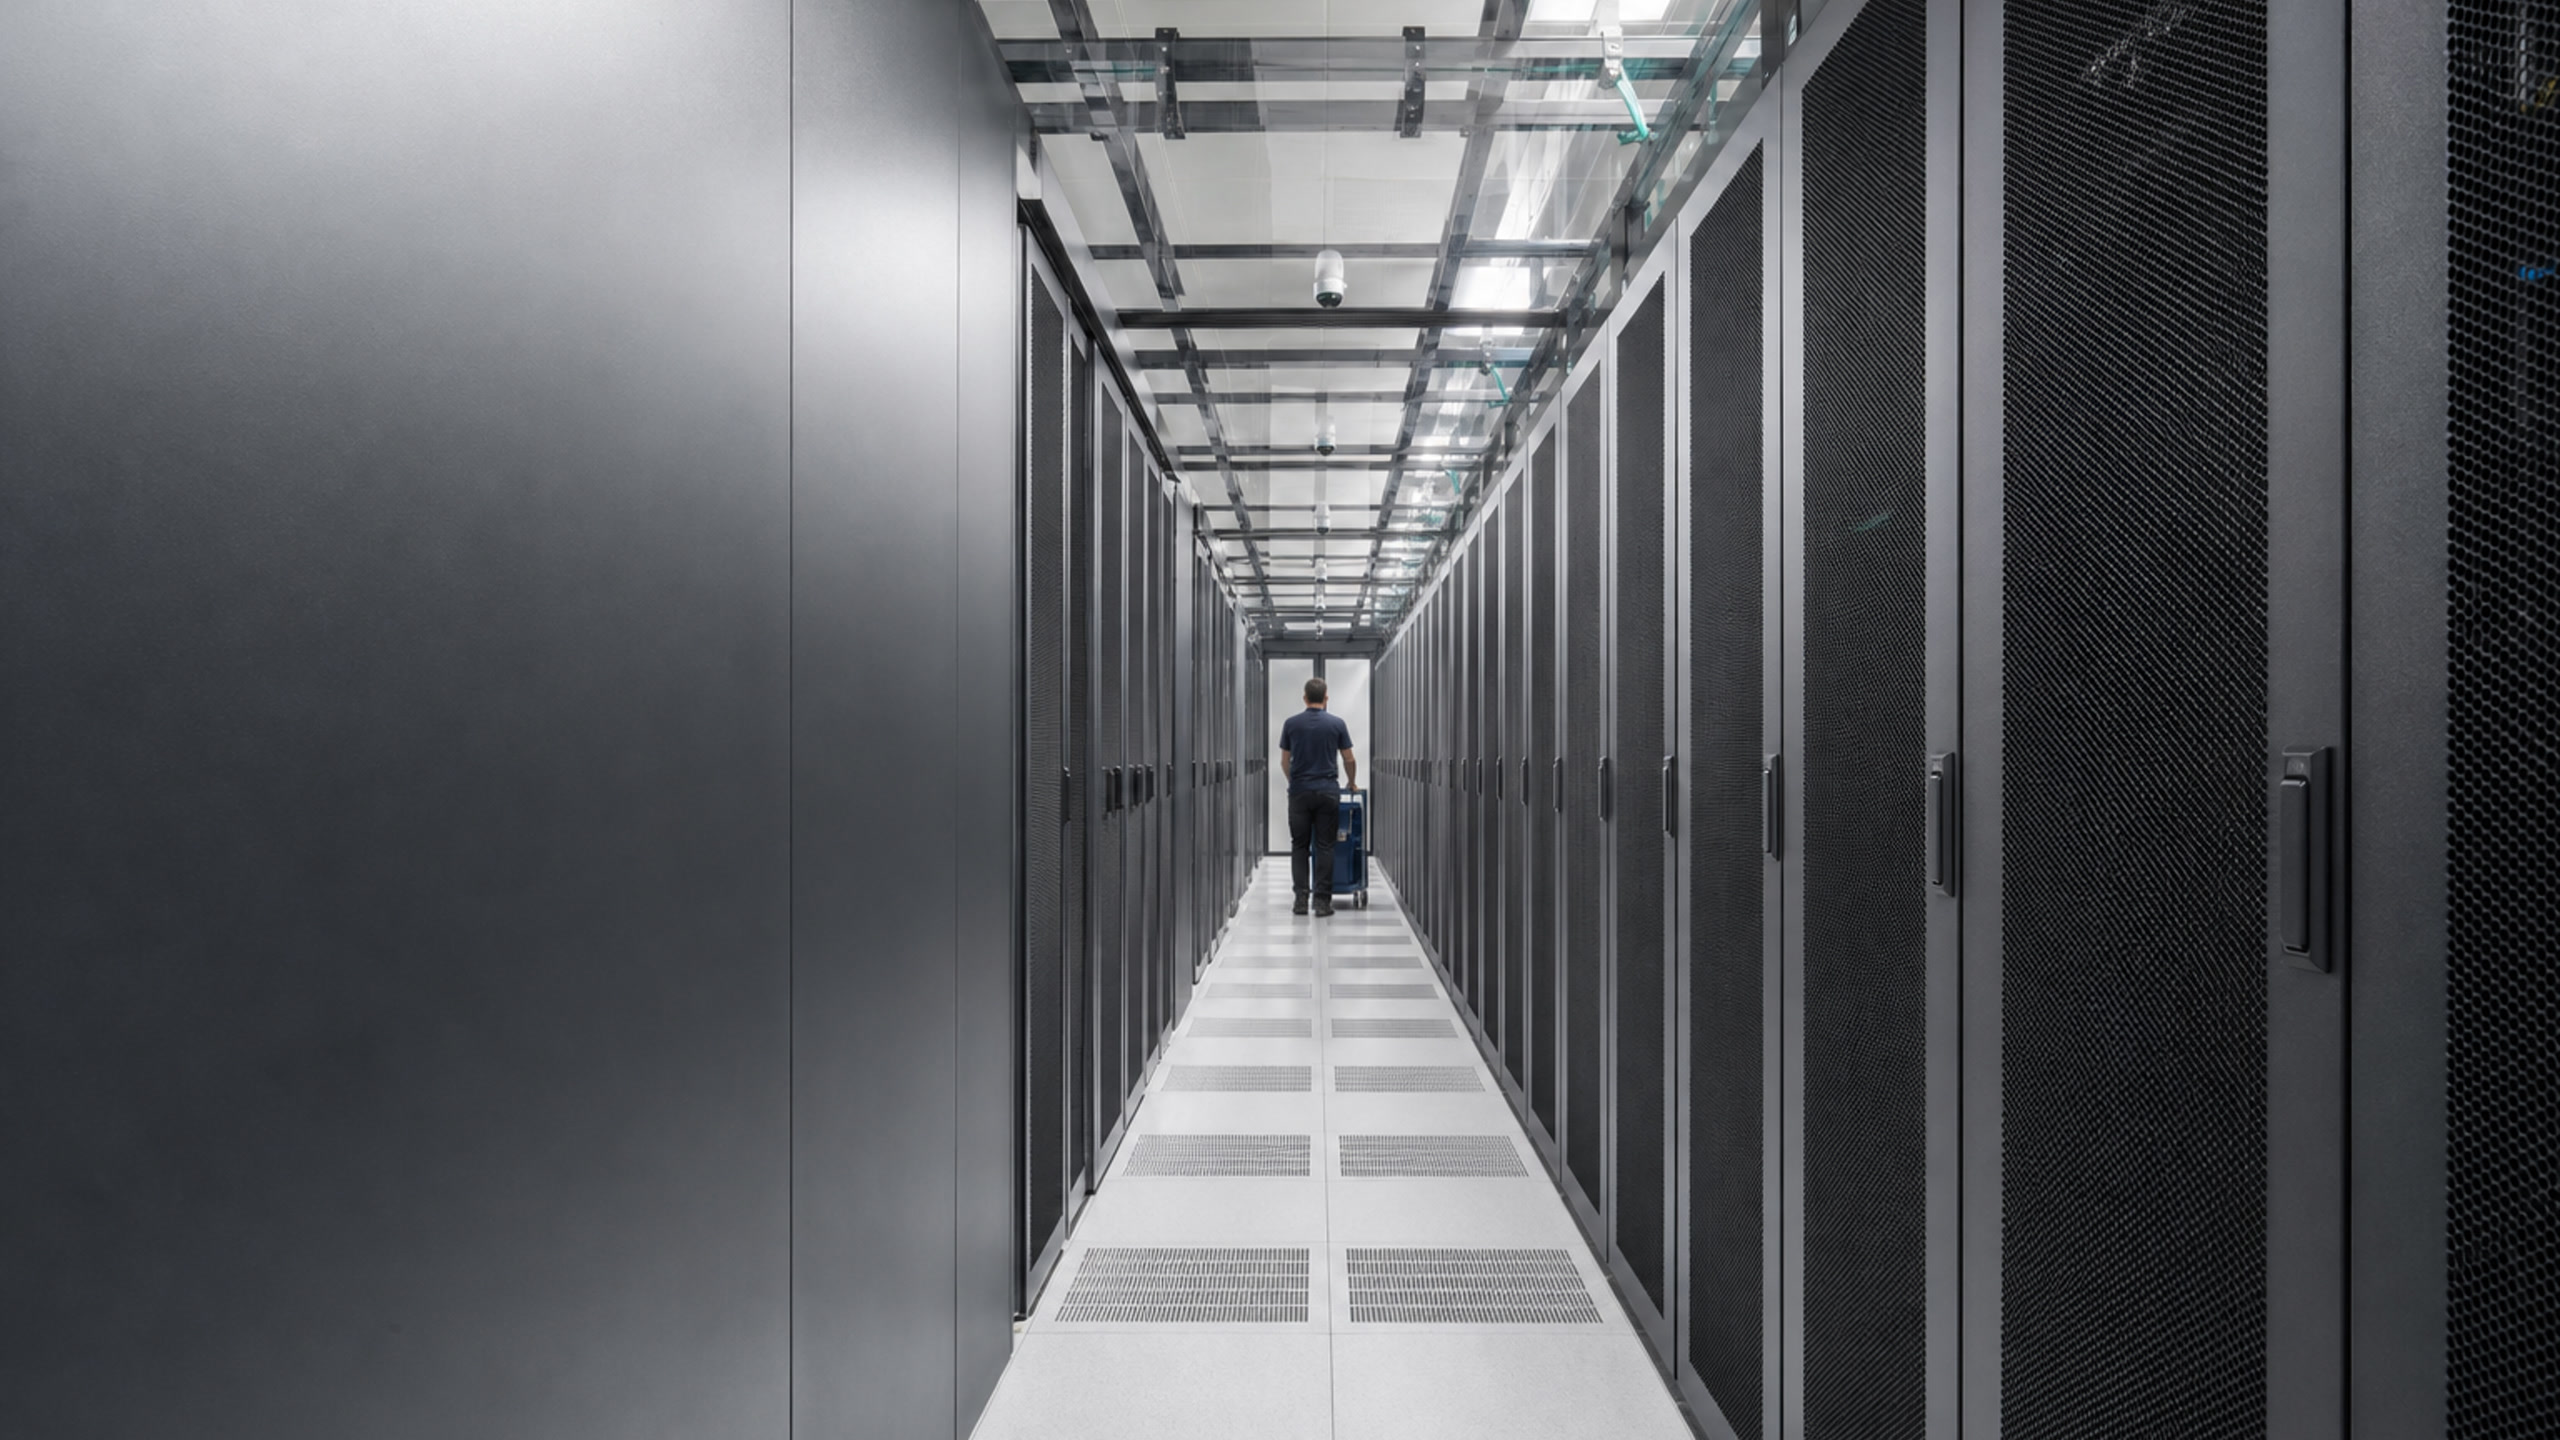
Rack-Inlet Thermal Excursions Under Comparable IT Load

Why it is hard: A warm rack-inlet reading can reflect load, airflow distribution, containment, pressure, cooling supply, sensor placement, or transient operations. It does not directly measure component temperature or prove hardware stress.

What Grayson analyzes: A prepared file containing rack-inlet temperatures, rack IT power, cold-aisle differential pressure, CRAH supply temperature, load bands, operating-period labels, and event context.

Ask Grayson: “Compare the two excursion windows with baseline periods at the same rack-load band. Which recorded signal changes first, and how long does each deviation persist?”

Outcome: Focus inspection on the affected time windows, probes, containment, perforated tiles, obstructions, and cooling context.
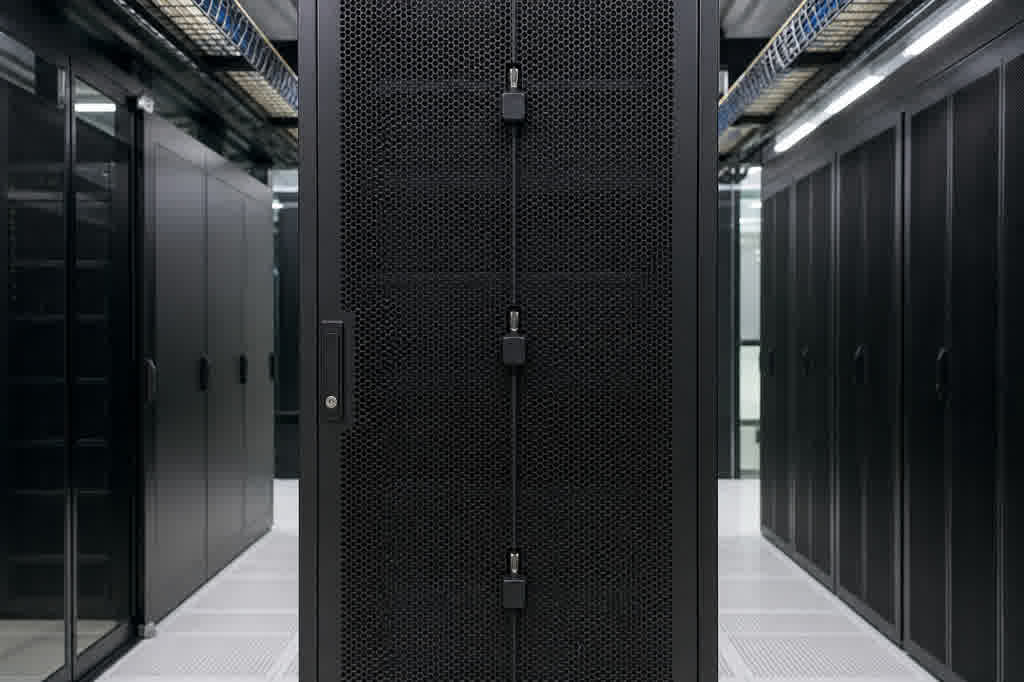
Data-center cold aisle with closed server racks and inlet-temperature probes

CRAH Fan-Command and Supply-Temperature Oscillation Investigation

Why it is hard: A cycling command or temperature signal can have multiple control, load, sensor, and hydraulic explanations. Fan command is not a direct measurement of delivered airflow.

What Grayson analyzes: A prepared, time-aligned CRAH file containing fan and valve commands, supply and return temperatures, plenum static pressure, equipment state, and pre/post operating-period labels.

Ask Grayson: “Compare the first two days with the final day. Quantify oscillation period, amplitude, and lead-lag relationships without assigning a controller cause.”

Outcome: Give the HVAC-controls specialist a reproducible before-and-after record for checking sensors, commands, actuators, hydraulics, tuning history, and load context.

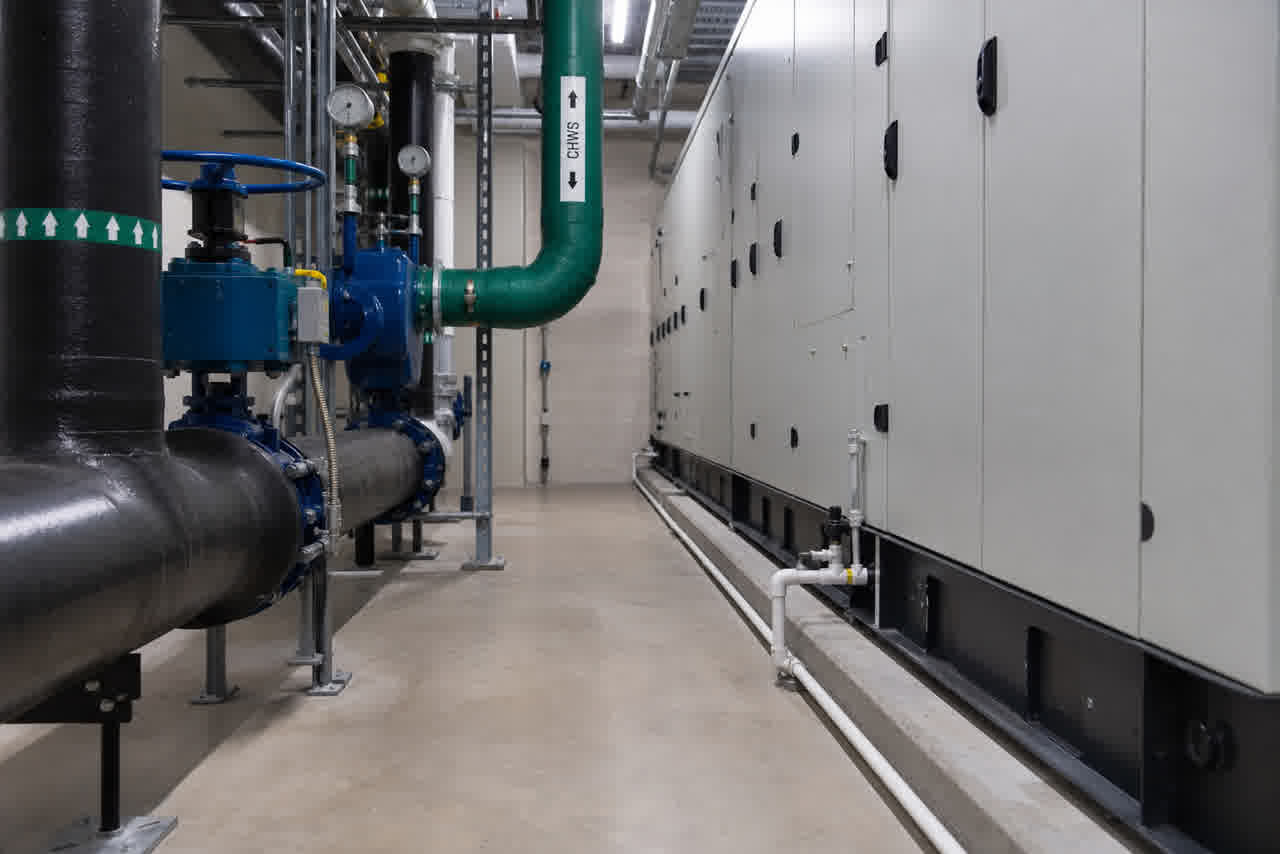
Perimeter CRAH unit with chilled-water piping in a data-center mechanical gallery

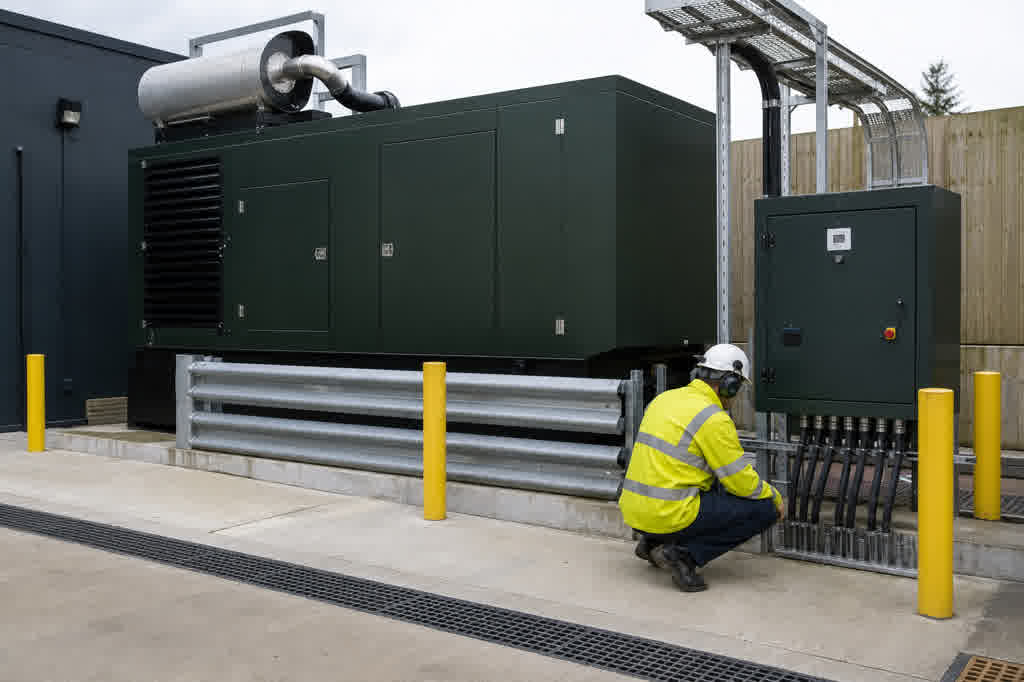
Standby Generator Test-Run Parameter Comparison

Why it is hard: Individual generator tests are commonly reviewed as separate logs. Slow change can be difficult to see unless runs are aligned by phase and elapsed time.

What Grayson analyzes: Prepared recurring test histories with test ID, elapsed seconds, loaded-run phase, engine speed, coolant temperature, oil pressure, output frequency, real power, and maintenance markers.

Ask Grayson: “Compare the steady loaded phase across all twelve runs. Which parameter shows the clearest trend while real power remains comparable?”

Outcome: Support inspection and maintenance planning with a documented historical pattern across comparable loaded-run phases.

Outdoor standby diesel generator yard with load-bank connection cabinet

Grayson TimeSeries

Grayson TimeSeries is a Microsoft Teams app that lets engineers and operators individually chat with their industrial process data for quick insights with a deterministic and auditable AI agent.

MICROSOFT COPILOT

Powered by Microsoft Copilot and available in Teams, making it easy to use within your Microsoft 365 ecosystem.

PROCESS DATA ANALYTICS

Grayson TimeSeries prepares and validates your process data automatically, detects anomalies, makes forecasts and establishes correlations.

FAQ

Answers to help you get started faster.

Real stories from teams who streamlined their workflow and delivered more with less.

What BMS, DCIM, cooling, and generator data can Grayson analyze?

Grayson AI analyzes prepared historical exports from BMS, DCIM, cooling, power, and generator systems when combined into one CSV or Excel file. Typical fields include rack-inlet temperatures, rack IT power, cold-aisle differential pressure, CRAH supply and return temperatures, fan and valve commands, plenum static pressure, generator speed, coolant temperature, oil pressure, frequency, real power, load bands, and test or maintenance markers.

Can Grayson compare rack-inlet temperatures at similar IT loads?

Yes. With rack-inlet temperatures, rack IT power, pressure, CRAH supply temperature, and load-band labels, Grayson AI can compare excursion windows with baseline periods at the same load band, flag which recorded signal changes first, and quantify how long each deviation persists. Component temperature, hardware stress, and environmental-envelope acceptance remain site engineering judgment.

Can Grayson quantify oscillation and lead-lag in CRAH control data?

Yes. On time-aligned CRAH records, Grayson AI can quantify oscillation period and amplitude and compare lead-lag among fan or valve commands, supply and return temperatures, and plenum pressure across selected operating periods. It surfaces a reproducible before-and-after record for review. Tuning, sensor, actuator, airflow, and chilled-water causes require controls and mechanical review.

Can Grayson compare parameters across recurring generator test runs?

Yes. With test ID, elapsed time, loaded-run phase, and key engine and electrical parameters, Grayson AI can overlay runs and compare trends during the steady loaded phase while real power remains comparable. Availability, fuel condition, load-bank adequacy, and standards compliance stay with qualified procedures and records.

How should data from separate critical-facility systems be prepared?

Export the needed tags from BMS, DCIM, meters, and generator systems, align timestamps, and combine them into one flat file. Include load bands, operating-period labels, event context, and maintenance markers when the question depends on them. Document units and any prepared reference fields. Grayson AI does not require a live connection for this file-based analysis.

How should site limits, standards, and compliance records be used with the analysis?

Include site-approved reference fields, equipment class, measurement location, and policy labels in the prepared file when comparing temperatures or test parameters to a limit. Grayson AI can compare recorded values with those prepared references. Applicability of ASHRAE guidance, NFPA or other standards, and formal compliance status remain with site procedures, instrumentation, and qualified review—not with the analysis alone.